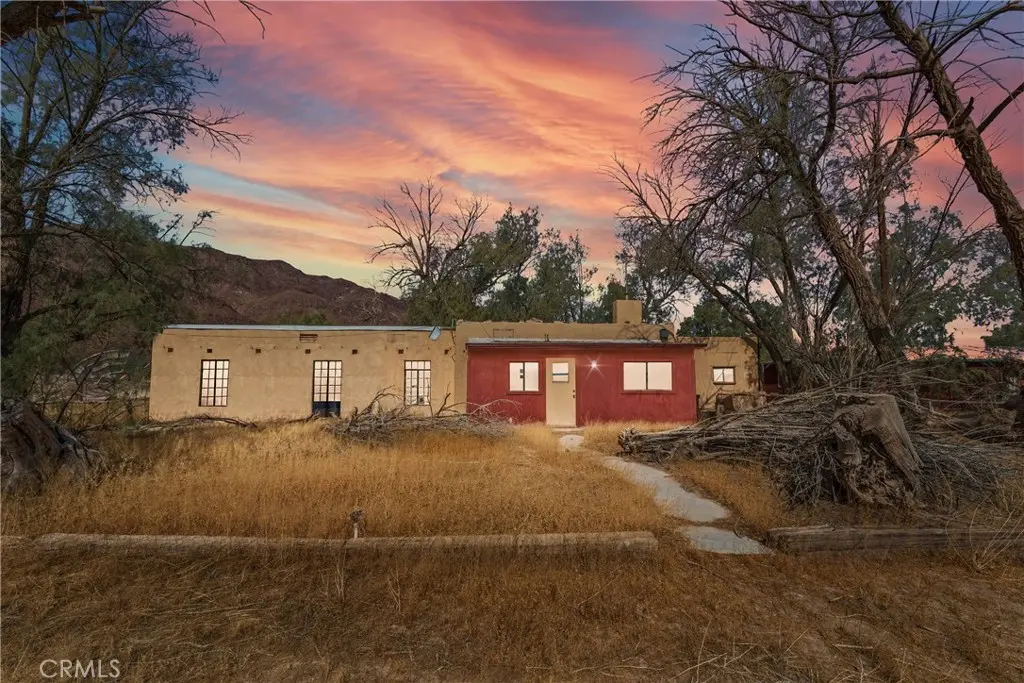
31011 Aleppo Ln · Newberry Springs, CA
Flood risk 1/10 · Minimal
- FEMA flood zone
- D
- Chance of flooding over 30 yrs
- 0.0%
- Est. flood insurance / yr
- $400 – $4,352
Fire risk 4/10 · Minor
- Est. fire insurance / yr
- $659 – $1,223
Heat risk 8/10 · Major
- Hot days now (above 104°F)
- 9 days/yr
- Hot days in 30 yrs
- 25 days/yr
Wind risk 1/10 · Minimal
- Chance of severe wind over 30 yrs
- —
Air-quality risk 7/10 · Major
- Unhealthy air days now
- 14 days/yr
- Unhealthy air days in 30 yrs
- 19 days/yr
Risk factors via First Street. Map © Google.
Why this score? — see what drove the C- grade
The composite is a weighted blend of 9 inputs, each scored 0–100. Each bar is that input's sub-score; the figure is the points it added to the 100-point composite (weight × sub-score).
- Cash flow +18.0/30.0
- ARV discount +8.3/15.0
- DSCR +5.6/10.0
- Appreciation +5.0/10.0
- 1% rule +3.6/10.0
- Schools +2.7/10.0
- Rent growth +2.5/5.0
- Livability +2.5/5.0
- Condition / age +2.5/5.0
$185,000
🖨 Deal sheet (PDF) 📄 Offer letter ✓ Due diligence
Listing remarks MLS
Start your own ranch by the Newberry Mountains as golden eagles soar overhead. This ranch property sits on 10 acres, located off a secure private road with it's own well. Built in 1940, the 1,166 SqFt home features classic architectural cues from the early days of desert living including thick wooden doors, iron-accented windows, a centerpiece brick-inlaid wood-burning stove and vintage appliances. If you know anything about ranches, you know it ain't all about the living quarters. There is over 5,000 SqFt of outbuildings on this property, including garages, workshops, washrooms, vehicle storage, a tack room, large cinder block garage and more! Horses are already welcome with two shelters on site and more. There is a pond behind the home made of volcanic red rock, perfect for ducks, chickens or even koi fish. A retro concrete swimming pool with waterslide and deck is included in the sale. This is the perfect starter ranch, or the ideal site for an off-road enthusiast looking to build a motocross track and have easy access to the open desert for their sand toys. This property has an amazing view of the Newberry Mountains, home to a large population of desert bighorn sheep. The full 10 acres is a combo of two parcels, APN 0528-081-61 and 0528-081-62.
Key facts
- 10 acre lot
- 4 garage spots
- Pool
Neighborhood map
What this means for you Summary
Snapshot
- This is a 2-bed/1.0-bath single-family listed at $185k.
Deal economics
- At list price, monthly cash flow is $159 ($2k/yr) — positive.
- The deal already cash-flows at list — no discount required.
- To meet the 1% rule (rent ≥ 1% of price), the offer needs to be $159k (13.9% below list).
- Recommended offer: $159k (13.9% below list) — sets the bar for 1% rule.
Location & tenants
- Location reads: area grade C — affects rentability + tenant quality, not the cash-flow math above.
- Silver Valley Unified (town): math 23% / reading 39% proficiency, ranked #323 of 517 in CA (top 62%) — families likely to look elsewhere, expect single-tenant / working-renter base with shorter leases.
- Zoned schools: Yermo Elementary (math 17% / reading 27%, grade F, #1,179 of 1,571 statewide, top 78%, 340 students, 83% FRL); Fort Irwin Middle (math 23% / reading 41%, grade F, #207 of 498 statewide, top 42%, 239 students, 40% FRL); Silver Valley High (math 37% / reading 67%, grade D+, #296 of 1,170 statewide, top 27%, 369 students, 59% FRL) — zoned schools average 60% FRL vs 32% district-wide (29 pts higher); higher-poverty schools than district average — tighter screening recommended.
- Market conditions: 211 active listings in the ZIP; 5,458 units permitted in San Bernardino County in 2024 (1,500 in 5+ unit buildings).
Forward outlook
- In year one you build about $7k of equity ($1k loan paydown + $6k appreciation (3.0% local appreciation)).
- San Bernardino County population projected at +15% by 2050 — modest demand growth; plan on rents tracking national, not racing it.
- At projected returns (3.0% appreciation + 3.0% rent growth), your $52k cash investment doubles in ~6 years — after that, you're playing with house money.
- By year 6, paydown + projected appreciation supports a ~$36k cash-out refi (75% LTV) — recoverable capital for the next deal without selling this one.
Negotiation context
- It's been on market 675 days — a 12% lower offer ($163k) is reasonable based on typical stale-listing flexibility.
- 3 sale attempts since 5y ago with the ask held roughly flat each time — persistent listings suggest the price (not the market) is what's stuck; bring a comps-based counter.
- Current owner paid $50k; list at $185k implies a 270% gain — meaningful room to come down on a strong offer.
Risks & watch-outs
- Watch-outs: built in 1940 — expect roof / HVAC / electrical / plumbing capex.
- Climate carrying-cost: extreme-heat days projected 9→25/yr by 2055 (HVAC capex compounding) — expect insurance premiums to compound above CPI over the hold.
Questions for the listing agent
- It's been on market 675 days. Have you received any prior offers? Is the seller open to a 14% concession, seller financing, or rate buy-down credit?
- Built in 1940 — when were the roof, HVAC, electrical panel, plumbing, and water heater last replaced?
- Why hasn't it sold? Are there any deal-killer items the seller is aware of (foundation, flood, title, zoning, code violations)?
- Is there a deadline driving the sale (1031 exchange, divorce, estate, relocation)? That informs how much negotiation room exists.
- What's the average days-on-market for RENTAL listings here right now (not sales)? A rising rental-DOM trend means longer vacancies and softer asking-rent achievability than the comps imply.
- What's the recent tenant-quality profile in this submarket — average credit score on applications, eviction rate, late-payment / NSF rate, and stable-employment percentage? A property-management company in the area should have these aggregated.
- How much new for-sale + rental construction is in the pipeline within 1–3 miles? Heavy new supply typically softens prices + rents 12–24 months out; constrained supply supports both.
Investment metrics
- 1% rule
- 0.86% ✗
- Cap rate
- 7.32%
- Cash-on-cash
- 3.68%
- DSCR
- 1.16
- GRM
- 9.7
CMA / ARV
- ARV (median comp)
- $188,247
- List price
- $185,000
- Delta
- -1.72%
- Verdict
- FAIR
- Comps
- 2 within 1.0 mi
Projected returns pro-forma
3.0% appreciation · 3.0% rent growth · sell at horizon
- IRR
- 10.9%
- Equity multiple
- 1.62×
- Total profit
- $32,304
- Equity at exit
- $83,184
- IRR
- 13.1%
- Equity multiple
- 2.94×
- Total profit
- $100,751
- Equity at exit
- $128,196
Cash invested: $51,800 (down + closing). Projections, not guarantees.
Landlord ↔ Tenant lean methodology
- Overall (STATE)
- 18 Strongly Tenant-Friendly
- State California
- 18 Strongly Tenant-Friendly · D+13
- County
- — inherits STATE
- City
- — inherits STATE
ZIP-level market 92365
- Active inventory
- 211
- Price-to-rent
- 9.7×
Monthly cashflow live
- Estimated rent
- $1,593 medium interval (Pro) →
- Mortgage (P&I)
- −$970
- Tax from tax record
- −$53 /mo · $635/yr
- Insurance
- −$77
- HOA
- −$0
- Vacancy / Maint / Mgmt
- −$335
- Net cashflow
- $159
Break-even live
Sensitivity live
| Price | -10% $263 | -5% $211 | +0% $159 | +5% $106 | +10% $54 |
|---|---|---|---|---|---|
| Rent | -10% $33 | -5% $96 | +0% $159 | +5% $222 | +10% $285 |
| Rate | -1.0pp $252 | -0.5pp $206 | base $159 | +0.5pp $111 | +1.0pp $62 |
UW: 25.0% down · 7.5% · 30yr · 1.5% tax · 5.0% vac · 8.0% maint · 8.0% mgmt
Financing live
Cash to close
- Down payment
- $46,250
- Closing costs
- $5,550
- Reserves months
- —
- Total cash needed
- —
Loan-product check · same deal, 3 products live
Conventional
25% down · 7.5% · 30yr
- Down + closing
- —
- Monthly P&I
- —
- Monthly cashflow
- —
- DSCR
- —
- Eligible?
- —
Personal DTI + credit; lowest rate.
DSCR
20% down · 8.5% · 30yr
- Down + closing
- —
- Monthly P&I
- —
- Monthly cashflow
- —
- DSCR
- —
- Eligible?
- —
No personal income docs; deal must DSCR.
Hard money
10% down · 12.0% · 12mo
- Down + closing
- —
- Monthly P&I
- —
- Monthly cashflow
- —
- DSCR
- —
- Eligible?
- —
Short-term bridge; refi at stabilization.
Listing history 22 events
-
2026-06-21days on market $185,000 Active 675 DOM
-
2026-06-18days on market $185,000 Active 672 DOM
-
2026-06-17days on market $185,000 Active 671 DOM
-
2026-06-16days on market $185,000 Active 670 DOM
-
2026-06-15days on market $185,000 Active 669 DOM
-
2026-06-13days on market $185,000 Active 667 DOM
-
2026-06-13days on market $185,000 Active 666 DOM
-
2026-06-09days on market $185,000 Active 663 DOM
-
2026-06-08days on market $185,000 Active 662 DOM
-
2026-06-07days on market $185,000 Active 661 DOM
-
2026-06-04days on market $185,000 Active 658 DOM
-
2026-06-03days on market $185,000 Active 657 DOM
-
2026-06-02days on market $185,000 Active 656 DOM
-
2026-06-01days on market $185,000 Active 655 DOM
-
2026-05-31days on market $185,000 Active 654 DOM
-
2024-08-15$185,000 Active 1268-char remark
Show marketing remark (1268 chars)
Start your own ranch by the Newberry Mountains as golden eagles soar overhead. This ranch property sits on 10 acres, located off a secure private road with it's own well. Built in 1940, the 1,166 SqFt home features classic architectural cues from the early days of desert living including thick wooden doors, iron-accented windows, a centerpiece brick-inlaid wood-burning stove and vintage appliances. If you know anything about ranches, you know it ain't all about the living quarters. There is over 5,000 SqFt of outbuildings on this property, including garages, workshops, washrooms, vehicle storage, a tack room, large cinder block garage and more! Horses are already welcome with two shelters on site and more. There is a pond behind the home made of volcanic red rock, perfect for ducks, chickens or even koi fish. A retro concrete swimming pool with waterslide and deck is included in the sale. This is the perfect starter ranch, or the ideal site for an off-road enthusiast looking to build a motocross track and have easy access to the open desert for their sand toys. This property has an amazing view of the Newberry Mountains, home to a large population of desert bighorn sheep. The full 10 acres is a combo of two parcels, APN 0528-081-61 and 0528-081-62.
-
2022-05-03historical
-
2021-11-12$350,000 Active
-
2021-09-28historical
-
2021-08-13$350,000 Active
-
2018-07-18soldstatus $50,000
-
2004-10-01soldstatus $120,000
ⓘ Source: listings_history table (triggers on properties + properties_extension) + one-shot
backfill from property_details.listing_events for pre-trigger history.
Tax reassessment forecast CA · Resets to sale price
- Current annual tax
- $635 · $53/mo
- Projected year-2 tax
- $1,406 · $117/mo
- Expected delta
- +$771/yr (+$64/mo · 121.6%)
ⓘ Screening estimate from a state-policy table — verify with the county assessor before closing.
Climate risk First Street
- Flood 1/10 Low FEMA zone D · 0% chance over 30 yrs
- Wildfire 4/10 Moderate
- Heat 8/10 Severe 9 d/yr ≥104°F today · 25 d/yr by 30 yrs out
- Wind 1/10 Low
- Air quality 7/10 Severe 14 unhealthy d/yr today · 19 by 30 yrs out
Nearby sold comps map
Loading sold comps map…
Walkable amenities ~0.75 mi
Loading nearby amenities…
Taxation est. · year 1
- Rental income
- $19,120
- − Mortgage interest
- −$10,363
- − Property taxes
- −$635
- − Insurance
- −$925
- − Repairs & maintenance
- −$1,530
- − Management
- −$1,530
- − Depreciation
- −$5,382
- Taxable loss
- −$1,243
- Est. tax savings @ 24.0%
- +$298
- After-tax cash flow
- $2,202/yr
For passive investors: Depreciation is non-cash, so a rental often shows a tax loss while cash-flowing — sheltering income. Rental losses are passive: they offset passive income freely, and up to $25,000/yr can offset ordinary (W-2) income if you actively participate and your MAGI is under $100k (phasing out to $0 by $150k); unused losses carry forward. On sale, claimed depreciation is recaptured at up to 25%, and gains may owe capital-gains tax (a 1031 exchange can defer both). Figures are a year-1 estimate at your 24.0% rate — not tax advice; consult a CPA.
Schools (NCES district)
- District
- Silver Valley Unified
- NCES district ID
- 0636820
- Math proficiency
- 23% ▼ -12.00%
- Reading proficiency
- 39% ▼ -12.00%
- Median HH income
- $48,754
- Composite
- 26.85/100
- National rank
- #7105
- State rank
- #323 of 517 in CA
Livability — Newberry Springs
No livability data for this city. (Only ~50 U.S. cities are tracked.)
Census & demographics
- Population (ZIP)
- 2,514
Population outlook (San Bernardino County) Hauer SSP2
- Today (2025)
- 2,300,329 people
- By 2030
- 2,378,907 · +3.4%
- By 2040
- 2,523,137 · +9.7%
- By 2050
- 2,642,388 · +14.9%
- By 2075
- 2,880,769 · +25.2%
- By 2100
- 2,909,436 · +26.5%
Race, ethnicity, and origin ACS 2023
- Neighborhood character
- Diverse neighborhood (Simpson 0.60)
- Race & ethnicity
- White 56% Hispanic / Latino 29% Two or more races 20% Asian 8% Black 2%
- Hispanic origin (detail)
- Mexican 14% Dominican 7%
- Common ancestry
- Romanian 5% Slovak 2% Serbian 2%
- Foreign-born
- 16% · Canada, Vietnam
- Languages at home
- 85% English-only · Spanish 8% Vietnamese 2% German/W. Germanic 2%
Political lean MEDSL · San Bernardino
- 2024 margin
- Toss-up / Even · D 47.5% · R 49.7% · Other 2.8%
- 2008→2024 swing
- -8.5pp toward R · 2008: 6.3pp · 2024: -2.1pp
- All cycles
- 2024: R+2.1 2020: D+10.7 2016: D+9.8 2012: D+5.4 2008: D+6.3
Not yet ingested
- Civics
- —
Market trends
- HPI YoY
- —
- Current HPI
- —
- Rent YoY
- —
- Metro
- —
- State GDP YoY
- ▲ 3.21%
- F500 in state
- 116
Industry mix (Fortune 500 HQ in CA)
| Industry | F500 HQs | Revenue |
|---|---|---|
| Technology | 27 | $1,492B |
|
||
| Financial Services | 3 | $174B |
|
||
| Retail | 3 | $44B |
|
||
| Insurance | 3 | $26B |
|
||
| Media / Entertainment | 2 | $115B |
|
||
| Pharmaceuticals / Biotech | 2 | $62B |
|
||
Price history
+54.2% since first listed7 events — show timeline
- 2024-08-15 Listed $185,000 CRMLS
- 2022-05-03 Listing Removed — CRMLS
- 2021-11-12 Listed $350,000 CRMLS
- 2021-09-28 Listing Removed — CRMLS
- 2021-08-13 Listed $350,000 CRMLS
- 2018-07-18 Sold (Public Records) $50,000 Public Records
- 2004-10-01 Sold (Public Records) $120,000 Public Records
Property tax history
-4.5%/yrLatest (2025): $635 · +1.7% YoY. Source: county tax records.
Cash-flow waterfall
monthlySold comps — $/sqft
last 12 mo · ≤1 miLoading sold comps…