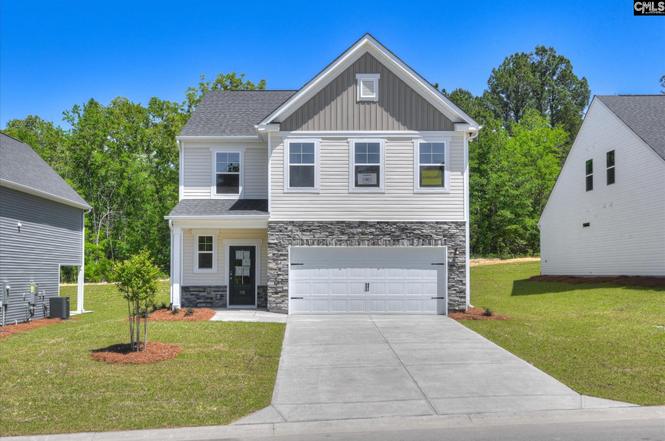
115 Bloomsbury Dr
Edmund, SC 29073
$279,900D-
3 bd · 2.5 ba ·
2,325 sqft ·
Built 2026
· SingleFamily
· Pending
· 164 DOM
Cashflow @ list (25.0% down · 7.5%)
Estimated rent
$2,438/mo
Mortgage (P&I)
−$1,468
Tax + insurance
−$466
HOA
−$33
Vac / Maint / Mgmt
−$512
Net cashflow
$-41/mo
Annual
$-492/yr
Cap rate
6.12%
Cash-on-cash
-0.63%
DSCR
0.97
1% rule
0.87%
Cash to close
$78,372
Investor read
- This is a 3-bed/2.5-bath single-family listed at $280k.
- At list price, monthly cash flow is $-41 ($-492/yr) — negative.
- To cash-flow at today's rent, offer at most $274k (2.1% below list).
- To meet the 1% rule (rent ≥ 1% of price), the offer needs to be $244k (12.9% below list).
- It's been on market 164 days — a 12% lower offer ($246k) is reasonable based on typical stale-listing flexibility.
- Recommended offer: $244k (12.9% below list) — sets the bar for 1% rule.
- Local home prices are declining (-3.0%/yr); year-one equity from $2k of loan paydown is wiped out by about $8k of value loss. Plan a longer hold.
- Location reads: area grade D — affects rentability + tenant quality, not the cash-flow math above.
- Lexington 02 (suburban): math 30% / reading 38% proficiency, ranked #45 of 80 in SC (top 56%) — families likely to look elsewhere, expect single-tenant / working-renter base with shorter leases.
- Zoned schools: Congaree Elementary (math 27% / reading 24%, grade F, #444 of 597 statewide, top 75%, 368 students, 100% FRL); Airport High (math 40% / reading 79%, grade C+, #110 of 196 statewide, top 58%, 1,428 students, 84% FRL) — zoned schools average 92% FRL vs 59% district-wide (33 pts higher); higher-poverty schools than district average — tighter screening recommended.
- Market conditions: Rents rising (+3.2%/yr); 563 active listings in the ZIP; 3 comparable units currently listed for rent nearby; rentals leasing fast (median 4d on market — plan ~1-2 weeks tenant-placement turnaround); solid renter incomes; 1,712 units permitted in Lexington County in 2024 (0 in 5+ unit buildings).
- Lexington County population projected at +26% by 2050 — long-run rental-demand tailwind backs the buy-and-hold thesis.
- This rent runs 38% of the median local income ($77k/yr) — at the standard rent-burdened threshold; future hikes will face affordability resistance.
Questions for listing agent
- What do current leases actually rent for vs. the listed asking? Can we see a recent rent roll and the last 12 months of T-12 income?
- It's been on market 164 days. Have you received any prior offers? Is the seller open to a 13% concession, seller financing, or rate buy-down credit?
- What does the HOA fee cover, when was the last increase, and are there any pending special assessments or reserve-fund shortfalls?
- Why hasn't it sold? Are there any deal-killer items the seller is aware of (foundation, flood, title, zoning, code violations)?
- Is there a deadline driving the sale (1031 exchange, divorce, estate, relocation)? That informs how much negotiation room exists.
- The area grade is low — what's the realistic commute time and amenity access for the typical tenant pool here? Any planned neighborhood developments (good or bad) we should know about?
- What's the average days-on-market for RENTAL listings here right now (not sales)? A rising rental-DOM trend means longer vacancies and softer asking-rent achievability than the comps imply.
- What's the recent tenant-quality profile in this submarket — average credit score on applications, eviction rate, late-payment / NSF rate, and stable-employment percentage? A property-management company in the area should have these aggregated.
CashFlowRE · CFR-6NEM6A0A1F67MY
· Data 5 h ago
cashflowre.app · 2026-05-29