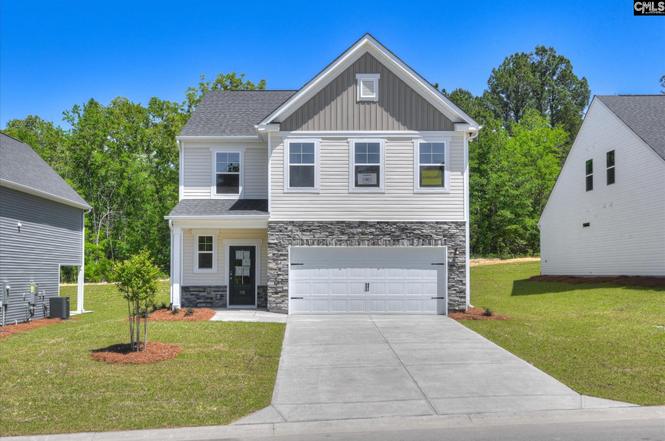
115 Bloomsbury Dr · Edmund, SC
Flood risk No data
- FEMA flood zone
- —
- Chance of flooding over 30 yrs
- —
- Est. flood insurance / yr
- —
Fire risk No data
- Est. fire insurance / yr
- —
Heat risk No data
- Hot days now (above threshold)
- —
- Hot days in 30 yrs
- —
Wind risk No data
- Chance of severe wind over 30 yrs
- —
Air-quality risk No data
- Unhealthy air days now
- —
- Unhealthy air days in 30 yrs
- —
Risk factors via First Street. Map © Google.
Why this score? — see what drove the D- grade
The composite is a weighted blend of 9 inputs, each scored 0–100. Each bar is that input's sub-score; the figure is the points it added to the 100-point composite (weight × sub-score).
- Cash flow +12.5/30.0
- ARV discount +7.5/15.0
- 1% rule +3.7/10.0
- DSCR +3.7/10.0
- Rent growth +3.3/5.0
- Schools +2.9/10.0
- Livability +2.5/5.0
- Condition / age +2.5/5.0
- Appreciation +0.0/10.0
$279,900
🖨 Deal sheet (PDF) 📄 Offer letter ✓ Due diligence
Listing remarks
Move-In Ready! Welcome to The Tyndall at Belgrave, a beautifully crafted home with a 2-car garage, designed for modern living and ultimate convenience. The main floor boasts an open layout, seamlessly connecting the kitchen, dining area, and family room—perfect for both daily life and entertaining guests. A pocket office provides a quiet spot for work or organizing, while the powder room adds extra practicality. Step outside to enjoy a large covered patio, ideal for outdoor lounging or dining under the stars. Upstairs, you'll find a versatile flex room that can adapt to your needs—whether it's a cozy media room, a play area, or even a home gym. The primary bedroom provides a pea
Key facts
- Pocket office
- Two large patios
- Open layout
Tags
Property features AI
Finance
- HOA & community: Property is part of an association
Exterior
- Parking: Attached 2-car garage
- Utilities: Public water; Public sewer
- Home design: Two-story residence
- Construction: Slab foundation
- Exterior features: Covered back porch; Patio; Full gutters; Automatic sprinkler system; Stone and vinyl exterior finish; Paved road access
Interior
- Kitchen: Eat-in kitchen with island; Granite countertops and tiled backsplash; Painted cabinets; Pantry; Microwave above stove
- Bedrooms: Master suite with double vanity, private bath, walk-in closet, tray ceilings, separate water closet, and carpeted floors (Second level); Bedroom 2 with walk-in closet, private closet, recessed lighting, and carpeted floors (Second level); Bedroom 3 with walk-in closet, private closet, recessed lighting, and carpeted floors (Second level)
- Flooring: Luxury vinyl plank in living room and kitchen; Carpet in bedrooms
- Bathrooms: Two full bathrooms; One half bathroom; Second full baths (additional full bathrooms listed)
- Heating & cooling: Central cooling (split system); Gas heating with split system (first level)
- Interior features: Recessed lighting throughout main living areas and bedrooms; Tankless hot water heater; Gas water heater; Recessed lights in living room; Luxury vinyl plank flooring in living room and kitchen
- Laundry & utility: Laundry area on second level; Electric hookup in heated laundry space
Neighborhood map
What this means for you Summary
Snapshot
- This is a 3-bed/2.5-bath single-family listed at $280k.
Deal economics
- At list price, monthly cash flow is $-41 ($-492/yr) — negative.
- To cash-flow at today's rent, offer at most $274k (2.1% below list).
- To meet the 1% rule (rent ≥ 1% of price), the offer needs to be $244k (12.9% below list).
- Recommended offer: $244k (12.9% below list) — sets the bar for 1% rule.
Location & tenants
- Location reads: area grade D — affects rentability + tenant quality, not the cash-flow math above.
- Lexington 02 (suburban): math 30% / reading 38% proficiency, ranked #45 of 80 in SC (top 56%) — families likely to look elsewhere, expect single-tenant / working-renter base with shorter leases.
- Zoned schools: Congaree Elementary (math 27% / reading 24%, grade F, #444 of 597 statewide, top 75%, 368 students, 100% FRL); Airport High (math 40% / reading 79%, grade C+, #110 of 196 statewide, top 58%, 1,428 students, 84% FRL) — zoned schools average 92% FRL vs 59% district-wide (33 pts higher); higher-poverty schools than district average — tighter screening recommended.
- Market conditions: Rents rising (+3.2%/yr); 563 active listings in the ZIP; 3 comparable units currently listed for rent nearby; rentals leasing fast (median 4d on market — plan ~1-2 weeks tenant-placement turnaround); solid renter incomes; 1,712 units permitted in Lexington County in 2024 (0 in 5+ unit buildings).
- This rent runs 38% of the median local income ($77k/yr) — at the standard rent-burdened threshold; future hikes will face affordability resistance.
Forward outlook
- Local home prices are declining (-3.0%/yr); year-one equity from $2k of loan paydown is wiped out by about $8k of value loss. Plan a longer hold.
- Lexington County population projected at +26% by 2050 — long-run rental-demand tailwind backs the buy-and-hold thesis.
Negotiation context
- It's been on market 164 days — a 12% lower offer ($246k) is reasonable based on typical stale-listing flexibility.
Questions for the listing agent
- What do current leases actually rent for vs. the listed asking? Can we see a recent rent roll and the last 12 months of T-12 income?
- It's been on market 164 days. Have you received any prior offers? Is the seller open to a 13% concession, seller financing, or rate buy-down credit?
- What does the HOA fee cover, when was the last increase, and are there any pending special assessments or reserve-fund shortfalls?
- Why hasn't it sold? Are there any deal-killer items the seller is aware of (foundation, flood, title, zoning, code violations)?
- Is there a deadline driving the sale (1031 exchange, divorce, estate, relocation)? That informs how much negotiation room exists.
- The area grade is low — what's the realistic commute time and amenity access for the typical tenant pool here? Any planned neighborhood developments (good or bad) we should know about?
- What's the average days-on-market for RENTAL listings here right now (not sales)? A rising rental-DOM trend means longer vacancies and softer asking-rent achievability than the comps imply.
- What's the recent tenant-quality profile in this submarket — average credit score on applications, eviction rate, late-payment / NSF rate, and stable-employment percentage? A property-management company in the area should have these aggregated.
- How much new for-sale + rental construction is in the pipeline within 1–3 miles? Heavy new supply typically softens prices + rents 12–24 months out; constrained supply supports both.
Investment metrics
- 1% rule
- 0.87% ✗
- Cap rate
- 6.12%
- Cash-on-cash
- -0.63%
- DSCR
- 0.97
- GRM
- 9.6
CMA / ARV
No comps found within radius.
Projected returns pro-forma
-3.0% appreciation · 3.24% rent growth · sell at horizon
- IRR
- -17.0%
- Equity multiple
- 0.40×
- Total profit
- $-47,322
- Equity at exit
- $41,734
- IRR
- -8.5%
- Equity multiple
- 0.47×
- Total profit
- $-41,906
- Equity at exit
- $24,201
Cash invested: $78,372 (down + closing). Projections, not guarantees.
Landlord ↔ Tenant lean methodology
- Overall (STATE)
- 90 Strongly Landlord-Friendly
- State South Carolina
- 90 Strongly Landlord-Friendly · R+6
- County
- — inherits STATE
- City
- — inherits STATE
ZIP-level market 29073
- Home prices YoY
- -19.1%
- Rents YoY
- 3.2%
- Active inventory
- 563
- Price-to-rent
- 9.6×
Monthly cashflow live
- Estimated rent
- $2,438 medium interval (Pro) →
- Mortgage (P&I)
- −$1,468
- Tax est. 1.5%
- −$350 /mo · $4,198/yr
- Insurance
- −$117
- HOA
- −$33
- Vacancy / Maint / Mgmt
- −$512
- Net cashflow
- $-41
Break-even live
Sensitivity live
| Price | -10% $152 | -5% $56 | +0% $-41 | +5% $-138 | +10% $-234 |
|---|---|---|---|---|---|
| Rent | -10% $-234 | -5% $-137 | +0% $-41 | +5% $55 | +10% $152 |
| Rate | -1.0pp $100 | -0.5pp $30 | base $-41 | +0.5pp $-114 | +1.0pp $-187 |
UW: 25.0% down · 7.5% · 30yr · 1.5% tax · 5.0% vac · 8.0% maint · 8.0% mgmt
Financing live
Cash to close
- Down payment
- $69,975
- Closing costs
- $8,397
- Reserves months
- —
- Total cash needed
- —
Loan-product check · same deal, 3 products live
Conventional
25% down · 7.5% · 30yr
- Down + closing
- —
- Monthly P&I
- —
- Monthly cashflow
- —
- DSCR
- —
- Eligible?
- —
Personal DTI + credit; lowest rate.
DSCR
20% down · 8.5% · 30yr
- Down + closing
- —
- Monthly P&I
- —
- Monthly cashflow
- —
- DSCR
- —
- Eligible?
- —
No personal income docs; deal must DSCR.
Hard money
10% down · 12.0% · 12mo
- Down + closing
- —
- Monthly P&I
- —
- Monthly cashflow
- —
- DSCR
- —
- Eligible?
- —
Short-term bridge; refi at stabilization.
Rent comps 3 comps
| Address | Beds | Baths | Sqft | Rent | $/sqft | DOM | Units | Dist |
|---|---|---|---|---|---|---|---|---|
| 2237 Trakand Dr Lexington, SC | 3.0 | 2.5 | 1962 | $1,975 | $1.01 | 3d | 1 | 1.24mi |
| 307 Savannah Hills Dr Lexington, SC | 3.0 | 2.5 | 1612 | $1,985 | $1.23 | 24d | 1 | 1.29mi |
| 985 Native Rye Way Lexington, SC | 4.0 | 3.0 | 3100 | $3,500 | $1.13 | 3d | 1 | 1.34mi |
HOA detail
- Monthly dues
- $33 · $396/yr
- Likely covers
- gym
Listing history 20 events
-
2026-06-17status $279,900 Pending 164 DOM
-
2026-06-17days on market $279,900 Active 164 DOM
-
2026-06-16days on market $279,900 Active 163 DOM
-
2026-06-15days on market $279,900 Active 162 DOM
-
2026-06-14days on market $279,900 Active 160 DOM
-
2026-06-13days on market $279,900 Active 159 DOM
-
2026-06-10days on market $279,900 Active 157 DOM
-
2026-06-09days on market $279,900 Active 156 DOM
-
2026-06-08days on market $279,900 Active 155 DOM
-
2026-06-07pricedays on market $279,900 Active 154 DOM
-
2026-06-05days on market $284,900 Active 151 DOM
-
2026-06-03days on market $284,900 Active 150 DOM
-
2026-06-03days on market $284,900 Active 149 DOM
-
2026-06-02days on market $284,900 Active 148 DOM
-
2026-05-31days on market $284,900 Active 147 DOM
-
2026-05-21price $284,900
-
2026-05-17price $291,750
-
2026-04-05price $291,900
-
2026-01-20price $289,900
-
2026-01-04$291,810 Active
ⓘ Source: listings_history table (triggers on properties + properties_extension) + one-shot
backfill from property_details.listing_events for pre-trigger history.
Nearby sold comps map
Loading sold comps map…
Walkable amenities ~0.75 mi
Loading nearby amenities…
Taxation est. · year 1
- Rental income
- $29,260
- − Mortgage interest
- −$15,679
- − Property taxes
- −$4,198
- − Insurance
- −$1,400
- − Repairs & maintenance
- −$2,341
- − Management
- −$2,341
- − HOA
- −$396
- − Depreciation
- −$8,143
- Taxable loss
- −$5,237
- Est. tax savings @ 24.0%
- +$1,257
- After-tax cash flow
- $764/yr
For passive investors: Depreciation is non-cash, so a rental often shows a tax loss while cash-flowing — sheltering income. Rental losses are passive: they offset passive income freely, and up to $25,000/yr can offset ordinary (W-2) income if you actively participate and your MAGI is under $100k (phasing out to $0 by $150k); unused losses carry forward. On sale, claimed depreciation is recaptured at up to 25%, and gains may owe capital-gains tax (a 1031 exchange can defer both). Figures are a year-1 estimate at your 24.0% rate — not tax advice; consult a CPA.
Schools (NCES district)
- District
- Lexington 02
- NCES district ID
- 4502730
- Math proficiency
- 30% ▼ -6.00%
- Reading proficiency
- 38% ▬ 0.00%
- Median HH income
- $42,532
- Composite
- 28.78/100
- National rank
- #6669
- State rank
- #45 of 80 in SC
Livability — Edmund
No livability data for this city. (Only ~50 U.S. cities are tracked.)
Census & demographics
- Census place
- Edmund, SC
- County
- Lexington County · 232,571 people
- Metro
- Columbia, SC
- Population (ZIP)
- 53,156
- Household income
- $77,229
- Rent vs Own
- Severe rent burden
- 935.0
Population outlook (Lexington County) Hauer SSP2
- Today (2025)
- 322,999 people
- By 2030
- 342,356 · +6.0%
- By 2040
- 377,715 · +16.9%
- By 2050
- 406,984 · +26.0%
- By 2075
- 465,447 · +44.1%
- By 2100
- 485,674 · +50.4%
Race, ethnicity, and origin ACS 2023
- Neighborhood character
- Predominantly White (72%)
- Race & ethnicity
- White 72% Black 14% Two or more races 7% Hispanic / Latino 6% Asian 2%
- Hispanic origin (detail)
- Mexican 2% Puerto Rican 1%
- Common ancestry
- Romanian 3% Italian 2% Slovak 1%
- Foreign-born
- 4% · Canada, China
- Languages at home
- 93% English-only · Spanish 5% Other Indo-European 1%
Political lean MEDSL · Lexington
- 2024 margin
- Solid R (+33.5) · D 32.5% · R 66.0% · Other 1.4%
- 2008→2024 swing
- +4.6pp toward D · 2008: -38.0pp · 2024: -33.5pp
- All cycles
- 2024: R+33.5 2020: R+30.1 2016: R+36.7 2012: R+37.8 2008: R+38.0
Not yet ingested
- Civics
- —
Market trends
- HPI YoY
- ▼ -59.20%
- Current HPI
- 249.8957
- Rent YoY
- ▲ 3.24%
- Metro
- Columbia, SC
- State GDP YoY
- ▲ 4.51%
- F500 in state
- 2
Industry mix (Fortune 500 HQ in SC)
| Industry | F500 HQs | Revenue |
|---|---|---|
| Packaging | 1 | $7B |
|
||
Price history
-2.4% since first listed5 events — show timeline
- 2026-05-21 Price Changed $284,900 Consolidated MLS
- 2026-05-17 Price Changed $291,750 Consolidated MLS
- 2026-04-05 Price Changed $291,900 Consolidated MLS
- 2026-01-20 Price Changed $289,900 Consolidated MLS
- 2026-01-04 Listed $291,810 Consolidated MLS
Cash-flow waterfall
monthlySold comps — $/sqft
last 12 mo · ≤1 miLoading sold comps…