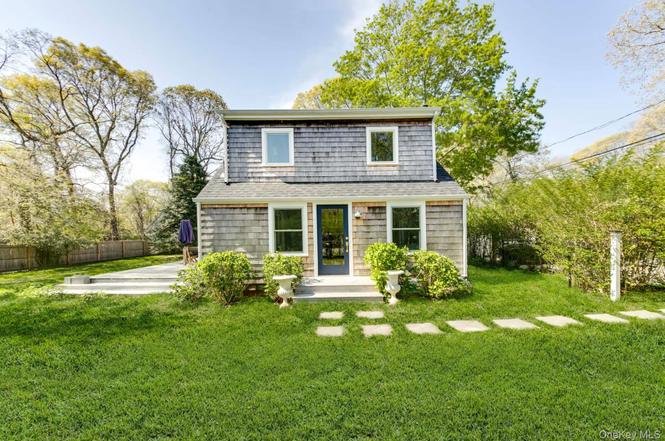
158 Gardiner Ave
Springs, NY 11937
$1,195,000B
3 bd · 3.0 ba ·
900 sqft ·
Built 1950
· SingleFamily
· Pending
· 41 DOM
Cashflow @ list (25.0% down · 7.5%)
Estimated rent
$21,009/mo
Mortgage (P&I)
−$6,267
Tax + insurance
−$1,028
HOA
−$0
Vac / Maint / Mgmt
−$4,412
Net cashflow
$9,302/mo
Annual
$111,626/yr
Cap rate
15.63%
Cash-on-cash
33.36%
DSCR
2.48
1% rule
1.76%
Cash to close
$334,600
Investor read
- This is a 3-bed/3.0-bath single-family listed at $1.20M.
- At list price, monthly cash flow is $9k ($112k/yr) — positive.
- The deal already cash-flows at list — no discount required.
- Meets the 1% rule at list price ($21k rent vs $1.20M).
- It's been on market 41 days — a 3% lower offer ($1.16M) is reasonable based on typical stale-listing flexibility.
- Recommended offer: $1.16M (3.0% below list) — sets the bar for market timing.
- Local home prices are declining (-3.0%/yr); year-one equity from $8k of loan paydown is wiped out by about $36k of value loss. Plan a longer hold.
- Location reads 63/100 on livability (#809 in NY) — a middle-class / working-renter tenant base. Strengths: crime A+, employment A+; Watch: housing C-, schools D-, amenities F.
- Springs Union Free School District (town): math 55% / reading 60% proficiency, ranked #239 of 590 in NY (top 40%) — acceptable for families but not a draw, mixed tenant base, ~2y average lease; only 9% free/reduced lunch — higher-income household profile.
- Watch-outs: built in 1950 — expect roof / HVAC / electrical / plumbing capex.
- Market conditions: Rents rising fast (+12.3%/yr); 135 active listings in the ZIP; 1 comparable units currently listed for rent nearby; high-income renter base; 1,366 units permitted in Suffolk County in 2024 (216 in 5+ unit buildings).
- Suffolk County population projected to shrink 5% by 2050 — rents likely to lag national; underwrite the cash flow, not the appreciation.
- 2 sale attempts with the ask held roughly flat each time — persistent listings suggest the price (not the market) is what's stuck; bring a comps-based counter.
- Current owner paid $700k; list at $1.20M implies a 71% gain — meaningful room to come down on a strong offer.
- At projected returns (-3.0% appreciation + 8.0% rent growth), your $335k cash investment doubles in ~4 years — after that, you're playing with house money.
- Climate carrying-cost: severe wind risk, 80% chance of damaging wind over 30y — expect insurance premiums to compound above CPI over the hold.
- Cap rate 15.6% vs local median 11.1% in Springs — top-decile yield for the area; either an underpriced asset or a hidden risk that comps aren't pricing in. Stress-test before assuming the spread holds.
- At $21,009/mo this rent would consume 194% of the median local household income ($130k/yr) (locally 896% of renters already pay >50% of income on rent) — very limited rent-growth headroom before tenants either downsize or default.
Questions for listing agent
- It's been on market 41 days. Have you received any prior offers? Is the seller open to a 3% concession, seller financing, or rate buy-down credit?
- Built in 1950 — when were the roof, HVAC, electrical panel, plumbing, and water heater last replaced?
- Is there a deadline driving the sale (1031 exchange, divorce, estate, relocation)? That informs how much negotiation room exists.
- Schools are D-rated, which usually means shorter tenancies and higher turnover. Who's the typical renter profile here, and what's been the actual vacancy rate?
- What's the average days-on-market for RENTAL listings here right now (not sales)? A rising rental-DOM trend means longer vacancies and softer asking-rent achievability than the comps imply.
- What's the recent tenant-quality profile in this submarket — average credit score on applications, eviction rate, late-payment / NSF rate, and stable-employment percentage? A property-management company in the area should have these aggregated.
- How much new for-sale + rental construction is in the pipeline within 1–3 miles? Heavy new supply typically softens prices + rents 12–24 months out; constrained supply supports both.
CashFlowRE · CFR-6P4CR3AS96ZMWS
· Data 3 weeks ago
cashflowre.app · 2026-05-29