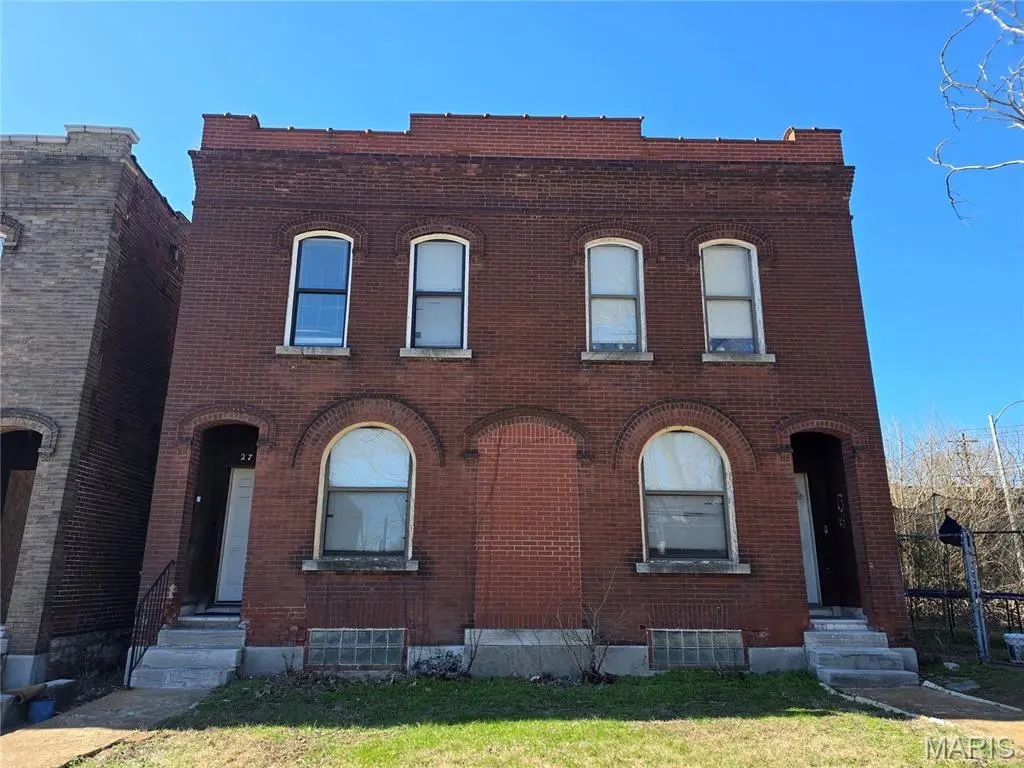
2716 Sullivan Ave
St. Louis, MO 63107
$75,000B-
6 bd · 5.0 ba ·
2,992 sqft ·
Built 1904
· MultiFamily
· Pending
· 28 DOM
Cashflow @ list (25.0% down · 7.5%)
Estimated rent
$2,608/mo
Mortgage (P&I)
−$393
Tax + insurance
−$181
HOA
−$0
Vac / Maint / Mgmt
−$548
Net cashflow
$1,486/mo
Annual
$17,838/yr
Cap rate
30.97%
Cash-on-cash
88.11%
DSCR
4.92
1% rule
3.48%
Cash to close
$21,000
Investor read
- This is a 2 × 3-bed/1.5-bath units multifamily listed at $75k. Condition is rated poor.
- At list price, monthly cash flow is $1k ($18k/yr) — positive. Per door: $743/mo.
- The deal already cash-flows at list — no discount required.
- Meets the 1% rule at list price ($3k rent vs $75k).
- It's been on market 28 days — a 2% lower offer ($74k) is reasonable based on typical stale-listing flexibility.
- Recommended offer: $74k (1.5% below list) — sets the bar for market timing.
- Local home prices are declining (-1.8%/yr); year-one equity from $519 of loan paydown is wiped out by about $1k of value loss. Plan a longer hold.
- Location reads: area grade B — affects rentability + tenant quality, not the cash-flow math above.
- St. Louis City (urban): math 10% / reading 18% proficiency, ranked #312 of 324 in MO (top 96%) — low school quality limits family demand, transient renter base, plan for 1-2y turnover; 80% free/reduced lunch — lower-income household profile, screen leases tightly.
- Watch-outs: flood insurance adds $56/mo; built in 1904 — expect roof / HVAC / electrical / plumbing capex.
- Market conditions: 58 active listings in the ZIP; 294 units permitted in St. Louis city in 2024 (227 in 5+ unit buildings).
- St. Louis County population projected to shrink 6% by 2050 — rents likely to lag national; underwrite the cash flow, not the appreciation.
- 2 sale attempts with the ask held roughly flat each time — persistent listings suggest the price (not the market) is what's stuck; bring a comps-based counter.
- At projected returns (-1.8% appreciation + 3.0% rent growth), your $21k cash investment doubles in ~2 years — after that, you're playing with house money.
- Climate carrying-cost: major flood risk; extreme-heat days projected 7→21/yr by 2055 (HVAC capex compounding) — expect insurance premiums to compound above CPI over the hold.
- Cap rate 31.0% vs local median 5.0% in St. Louis — top-decile yield for the area; either an underpriced asset or a hidden risk that comps aren't pricing in. Stress-test before assuming the spread holds.
Questions for listing agent
- Can we see the unit-by-unit rent roll, current vacancy, and any below-market leases? What's the average tenancy length?
- What capital expenditures (roof, boiler, parking lot, exteriors) have been made in the last 5 years, and what's planned in the next 2?
- Have any recent inspections been done? Can we get a copy of the seller's disclosures and any deferred-maintenance estimates?
- Built in 1904 — when were the roof, HVAC, electrical panel, plumbing, and water heater last replaced?
- What's the actual annual flood-insurance premium (NFIP or private), and is the property in a SFHA with mandatory coverage?
- Is there a deadline driving the sale (1031 exchange, divorce, estate, relocation)? That informs how much negotiation room exists.
- What's the average days-on-market for RENTAL listings here right now (not sales)? A rising rental-DOM trend means longer vacancies and softer asking-rent achievability than the comps imply.
- What's the recent tenant-quality profile in this submarket — average credit score on applications, eviction rate, late-payment / NSF rate, and stable-employment percentage? A property-management company in the area should have these aggregated.
Repairs flagged (vision-AI assessment)
- Major: Roof — Signs of wear and potential leaks.
- Major: Exterior Siding — Missing siding and peeling brick.
- Major: Front Porch — Dilapidated and in poor condition.
- Major: Kitchen Flooring — Worn and carpeted.
- Major: Bathroom Fixtures — Outdated and stained.
- Major: Interior Walls — Peeling paint and signs of wear.
CashFlowRE · CFR-6P7AMF2N5S4CSZ
· Data 3 weeks ago
cashflowre.app · 2026-05-29