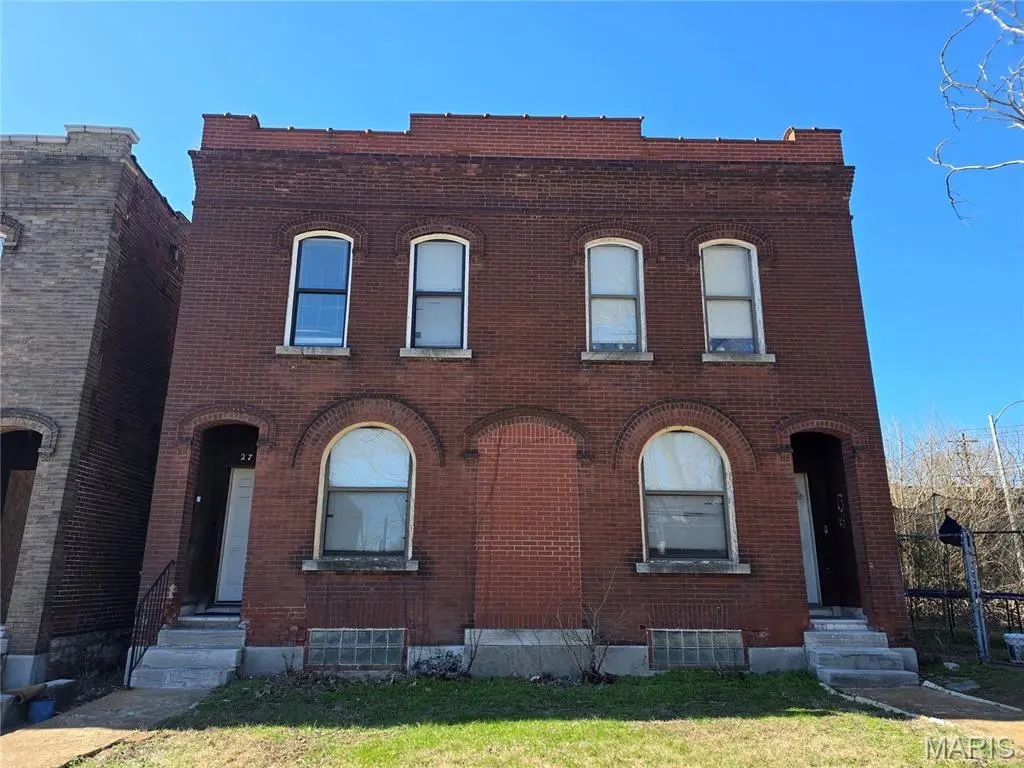
 Duplex
2716 Sullivan Ave · St. Louis, MO
Flood risk 7/10 · Major
- FEMA flood zone
- X (unshaded)
- Chance of flooding over 30 yrs
- 0.78%
- Est. flood insurance / yr
- $473 – $860
Fire risk 1/10 · Minimal
- Est. fire insurance / yr
- $1,054 – $1,958
Heat risk 5/10 · Moderate
- Hot days now (above 108°F)
- 7 days/yr
- Hot days in 30 yrs
- 21 days/yr
Wind risk 2/10 · Minimal
- Chance of severe wind over 30 yrs
- 1.0%
Air-quality risk 4/10 · Minor
- Unhealthy air days now
- 5 days/yr
- Unhealthy air days in 30 yrs
- 6 days/yr
Risk factors via First Street. Map © Google.
Why this score? — see what drove the B- grade
The composite is a weighted blend of 9 inputs, each scored 0–100. Each bar is that input's sub-score; the figure is the points it added to the 100-point composite (weight × sub-score).
- Cash flow +30.0/30.0
- 1% rule +10.0/10.0
- DSCR +10.0/10.0
- ARV discount +4.2/15.0
- Appreciation +4.1/10.0
- Rent growth +2.5/5.0
- Livability +2.5/5.0
- Schools +1.2/10.0
- Condition / age +1.0/5.0
$75,000
🖨 Deal sheet 📄 Offer letter ✓ Due diligence
Multi-family units
County records classify this as Multi-Family (2-4 Unit). Listing-text estimate: 2 units. confirmed
Listing remarks MLS
Great investment opportunity to own a brick duplex. Each unit has 3 beds and 1 1/2 baths with an unfinished basement. One side is rented for $500/month, and the other $950/month, The 2718 side was recently remodeled and has in unit laundry. Other unit has laundry hookups in the basement. Owner pays water and sewer, and tenants pay all other utilities. Being sold in as is condition at this great price - don't miss out!
Key facts
- 4,403 sq ft lot
- Built 1904
- Listed 28 days
Neighborhood map
What this means for you Summary
Snapshot
- This is a 2 × 3-bed/1.5-bath units multifamily listed at $75k. Condition is rated poor.
Deal economics
- At list price, monthly cash flow is $1k ($18k/yr) — positive. Per door: $743/mo.
- The deal already cash-flows at list — no discount required.
- Meets the 1% rule at list price ($3k rent vs $75k).
- Recommended offer: $74k (1.5% below list) — sets the bar for market timing.
- Cap rate 31.0% vs local median 5.0% in St. Louis — top-decile yield for the area; either an underpriced asset or a hidden risk that comps aren't pricing in. Stress-test before assuming the spread holds.
Location & tenants
- Location reads: area grade B — affects rentability + tenant quality, not the cash-flow math above.
- St. Louis City (urban): math 10% / reading 18% proficiency, ranked #312 of 324 in MO (top 96%) — low school quality limits family demand, transient renter base, plan for 1-2y turnover; 80% free/reduced lunch — lower-income household profile, screen leases tightly.
- Market conditions: 58 active listings in the ZIP; 294 units permitted in St. Louis city in 2024 (227 in 5+ unit buildings).
Forward outlook
- Local home prices are declining (-1.8%/yr); year-one equity from $519 of loan paydown is wiped out by about $1k of value loss. Plan a longer hold.
- St. Louis County population projected to shrink 6% by 2050 — rents likely to lag national; underwrite the cash flow, not the appreciation.
- At projected returns (-1.8% appreciation + 3.0% rent growth), your $21k cash investment doubles in ~2 years — after that, you're playing with house money.
Negotiation context
- It's been on market 28 days — a 2% lower offer ($74k) is reasonable based on typical stale-listing flexibility.
- 2 sale attempts with the ask held roughly flat each time — persistent listings suggest the price (not the market) is what's stuck; bring a comps-based counter.
Risks & watch-outs
- Watch-outs: flood insurance adds $56/mo; built in 1904 — expect roof / HVAC / electrical / plumbing capex.
- Climate carrying-cost: major flood risk; extreme-heat days projected 7→21/yr by 2055 (HVAC capex compounding) — expect insurance premiums to compound above CPI over the hold.
Questions for the listing agent
- Can we see the unit-by-unit rent roll, current vacancy, and any below-market leases? What's the average tenancy length?
- What capital expenditures (roof, boiler, parking lot, exteriors) have been made in the last 5 years, and what's planned in the next 2?
- Have any recent inspections been done? Can we get a copy of the seller's disclosures and any deferred-maintenance estimates?
- Built in 1904 — when were the roof, HVAC, electrical panel, plumbing, and water heater last replaced?
- What's the actual annual flood-insurance premium (NFIP or private), and is the property in a SFHA with mandatory coverage?
- Is there a deadline driving the sale (1031 exchange, divorce, estate, relocation)? That informs how much negotiation room exists.
- What's the average days-on-market for RENTAL listings here right now (not sales)? A rising rental-DOM trend means longer vacancies and softer asking-rent achievability than the comps imply.
- What's the recent tenant-quality profile in this submarket — average credit score on applications, eviction rate, late-payment / NSF rate, and stable-employment percentage? A property-management company in the area should have these aggregated.
- How much new apartment / multifamily construction is in the pipeline within 1–3 miles? Heavy new supply (>2% of stock underway) typically softens rents 12–24 months out; light construction supports rent growth.
Investment metrics
- 1% rule
- 3.48% ✓
- Cap rate
- 30.97%
- Cash-on-cash
- 88.11%
- DSCR
- 4.92
- GRM
- 2.4
CMA / ARV
- ARV (median comp)
- $69,865
- List price
- $75,000
- Delta
- 7.35%
- Verdict
- FAIR
- Comps
- 20 within 1.0 mi
Show comp detail 5 sales within ~0.75 mi
| Address | Dist | Beds/Ba | Sqft | Sold | Price | $/sf | Match |
|---|---|---|---|---|---|---|---|
| 3840 Saint Louis Ave | 0.59mi | 5/3.0 (-1) | 2,880 (-4%) | 11mo | $55,000 | $19 | 44 |
| 3843 Saint Ferdinand Ave | 0.74mi | 6/2.0 | 2,788 (-7%) | 1mo | $325,000 | $117 | 42 |
| 3800 Greer Ave #2 | 0.48mi | 5/2.0 (-1) | 2,726 (-9%) | 14mo | $79,900 | $29 | 34 |
| 3949 Palm St | 0.73mi | 7/2.0 (+1) | 2,620 (-12%) | 9mo | $55,000 | $21 | 21 |
| 3847 Greer Ave | 0.56mi | 7/2.0 (+1) | 2,652 (-11%) | 23mo | $195,000 | $74 | 19 |
Match score weights: distance 35% · size 25% · config 20% · recency 20%. Top-matched comps best support the ARV.
Projected returns pro-forma
-1.75% appreciation · 3.0% rent growth · sell at horizon
- IRR
- 86.2%
- Equity multiple
- 5.12×
- Total profit
- $86,591
- Equity at exit
- $15,434
- IRR
- 88.6%
- Equity multiple
- 10.58×
- Total profit
- $201,219
- Equity at exit
- $14,027
Cash invested: $21,000 (down + closing). Projections, not guarantees.
Landlord ↔ Tenant lean methodology
- Overall (STATE)
- 81 Strongly Landlord-Friendly
- State Missouri
- 81 Strongly Landlord-Friendly · R+10
- County
- — inherits STATE
- City
- — inherits STATE
ZIP-level market 63107
- Home prices YoY
- -1.9%
- Active inventory
- 58
- Price-to-rent
- 4.8×
Monthly cashflow live
- Estimated rent
- $2,608 high interval (Pro) →
- Mortgage (P&I)
- −$393
- Tax est. 1.5%
- −$94 /mo · $1,125/yr
- Insurance
- −$31
- Flood insurance flood zone
- −$56 /mo · $666/yr
- HOA
- −$0
- Vacancy / Maint / Mgmt
- −$548
- Net cashflow
- $1,486
Break-even live
2-unit breakdown (identical units grouped — click to expand)
| Units | Beds | Baths | Est. rent |
|---|---|---|---|
| 2× units | 3 | 1.5 | $2,608 |
| #1 | 3 | 1.5 | $1,304 |
| #2 | 3 | 1.5 | $1,304 |
| Total (2 units) | $2,608 | ||
UW: 25.0% down · 7.5% · 30yr · 1.5% tax · 5.0% vac · 8.0% maint · 8.0% mgmt
Financing live
Cash to close
- Down payment
- $18,750
- Closing costs
- $2,250
- Reserves months
- —
- Total cash needed
- —
Loan-product check · same deal, 3 products live
Conventional
25% down · 7.5% · 30yr
- Down + closing
- —
- Monthly P&I
- —
- Monthly cashflow
- —
- DSCR
- —
- Eligible?
- —
Personal DTI + credit; lowest rate.
DSCR
20% down · 8.5% · 30yr
- Down + closing
- —
- Monthly P&I
- —
- Monthly cashflow
- —
- DSCR
- —
- Eligible?
- —
No personal income docs; deal must DSCR.
Hard money
10% down · 12.0% · 12mo
- Down + closing
- —
- Monthly P&I
- —
- Monthly cashflow
- —
- DSCR
- —
- Eligible?
- —
Short-term bridge; refi at stabilization.
Listing history 4 events
-
2026-05-05status Pending 421-char remark
Show marketing remark (421 chars)
Great investment opportunity to own a brick duplex. Each unit has 3 beds and 1 1/2 baths with an unfinished basement. One side is rented for $500/month, and the other $950/month, The 2718 side was recently remodeled and has in unit laundry. Other unit has laundry hookups in the basement. Owner pays water and sewer, and tenants pay all other utilities. Being sold in as is condition at this great price - don't miss out!
-
2026-04-28status Active 421-char remark
Show marketing remark (421 chars)
Great investment opportunity to own a brick duplex. Each unit has 3 beds and 1 1/2 baths with an unfinished basement. One side is rented for $500/month, and the other $950/month, The 2718 side was recently remodeled and has in unit laundry. Other unit has laundry hookups in the basement. Owner pays water and sewer, and tenants pay all other utilities. Being sold in as is condition at this great price - don't miss out!
-
2026-03-24status Pending 421-char remark
Show marketing remark (421 chars)
Great investment opportunity to own a brick duplex. Each unit has 3 beds and 1 1/2 baths with an unfinished basement. One side is rented for $500/month, and the other $950/month, The 2718 side was recently remodeled and has in unit laundry. Other unit has laundry hookups in the basement. Owner pays water and sewer, and tenants pay all other utilities. Being sold in as is condition at this great price - don't miss out!
-
2026-03-02$75,000 Active 421-char remark
Show marketing remark (421 chars)
Great investment opportunity to own a brick duplex. Each unit has 3 beds and 1 1/2 baths with an unfinished basement. One side is rented for $500/month, and the other $950/month, The 2718 side was recently remodeled and has in unit laundry. Other unit has laundry hookups in the basement. Owner pays water and sewer, and tenants pay all other utilities. Being sold in as is condition at this great price - don't miss out!
ⓘ Source: listings_history table (triggers on properties + properties_extension) + one-shot
backfill from property_details.listing_events for pre-trigger history.
Climate risk First Street
- Flood 7/10 Severe FEMA zone X (unshaded) · 78% chance over 30 yrs
- Wildfire 1/10 Low
- Heat 5/10 Major 7 d/yr ≥108°F today · 21 d/yr by 30 yrs out
- Wind 2/10 Low 100% chance of damaging wind over 30 yrs
- Air quality 4/10 Moderate 5 unhealthy d/yr today · 6 by 30 yrs out
Nearby sold comps map
Loading sold comps map…
Walkable amenities ~0.75 mi
Loading nearby amenities…
Taxation est. · year 1
- Rental income
- $31,296
- − Mortgage interest
- −$4,201
- − Property taxes
- −$1,125
- − Insurance
- −$1,042
- − Repairs & maintenance
- −$2,504
- − Management
- −$2,504
- − Depreciation
- −$2,182
- Taxable income
- $17,739
- Est. tax owed @ 24.0%
- −$4,257
- After-tax cash flow
- $13,580/yr
For passive investors: Depreciation is non-cash, so a rental often shows a tax loss while cash-flowing — sheltering income. Rental losses are passive: they offset passive income freely, and up to $25,000/yr can offset ordinary (W-2) income if you actively participate and your MAGI is under $100k (phasing out to $0 by $150k); unused losses carry forward. On sale, claimed depreciation is recaptured at up to 25%, and gains may owe capital-gains tax (a 1031 exchange can defer both). Figures are a year-1 estimate at your 24.0% rate — not tax advice; consult a CPA.
Condition & rehab AI · 11 photos
This two-unit brick duplex requires extensive repairs and updates to bring it up to modern standards, significantly increasing its resale and rental value.
Repairs flagged
- Major Roof — Signs of wear and potential leaks.
- Major Exterior Siding — Missing siding and peeling brick.
- Major Front Porch — Dilapidated and in poor condition.
- Major Kitchen Flooring — Worn and carpeted.
- Major Bathroom Fixtures — Outdated and stained.
- Major Interior Walls — Peeling paint and signs of wear.
- Major Water Heater — Appears old and may need replacement.
- Major Furnace — Appears old and may need replacement.
Value-add opportunities
- Both Landscaping and curb appeal — A well-maintained yard and curb appeal can attract more tenants and buyers.
- Both Kitchen and bathroom updates — Modernizing the kitchen and bathrooms can significantly increase the home's value.
- Both Roof and exterior repairs — A new roof and exterior repairs will improve the home's appearance and functionality.
Renovation cost estimate screening
| Repair item | Severity | Est. cost |
|---|---|---|
| Roof · Signs of wear and potential leaks. | Major | $15,000–50,000 |
| Exterior Siding · Missing siding and peeling brick. | Major | $15,000–50,000 |
| Front Porch · Dilapidated and in poor condition. | Major | $15,000–50,000 |
| Kitchen Flooring · Worn and carpeted. | Major | $15,000–50,000 |
| Bathroom Fixtures · Outdated and stained. | Major | $15,000–50,000 |
| Interior Walls · Peeling paint and signs of wear. | Major | $15,000–50,000 |
| Water Heater · Appears old and may need replacement. | Major | $15,000–50,000 |
| Furnace · Appears old and may need replacement. | Major | $15,000–50,000 |
| Total estimated repair cost · 8 items | $120,000–400,000 |
Value-add ROI direction
- Both Landscaping and curb appeal — A well-maintained yard and curb appeal can attract more tenants and buyers. ↑
- Both Kitchen and bathroom updates — Modernizing the kitchen and bathrooms can significantly increase the home's value. ↑
- Both Roof and exterior repairs — A new roof and exterior repairs will improve the home's appearance and functionality. ↑
ⓘ Cost ranges are severity-bucket heuristics (US national rule-of-thumb). Get contractor quotes + a written scope before underwriting a rehab budget.
Schools (NCES district)
- District
- St. Louis City
- NCES district ID
- 2929280
- Math proficiency
- 10% ▼ -6.00%
- Reading proficiency
- 18% ▼ -3.00%
- Median HH income
- $35,685
- Composite
- 11.54/100
- National rank
- #9699
- State rank
- #312 of 324 in MO
Livability — St. Louis
No livability data for this city. (Only ~50 U.S. cities are tracked.)
Census & demographics
- Census place
- St. Louis, MO
- City population
- 283,259
- Population (ZIP)
- 9,082
Population outlook (St. Louis County) Hauer SSP2
- Today (2025)
- 315,737 people
- By 2030
- 313,865 · -0.6%
- By 2040
- 305,439 · -3.3%
- By 2050
- 296,529 · -6.1%
- By 2075
- 271,028 · -14.2%
- By 2100
- 255,359 · -19.1%
Race, ethnicity, and origin ACS 2023
- Neighborhood character
- Predominantly Black (89%)
- Race & ethnicity
- Black 89% White 8% Hispanic / Latino 2% Two or more races 2%
- Common ancestry
- Lithuanian 1%
- Foreign-born
- 1% · Canada
- Languages at home
- 98% English-only · Spanish 1%
Political lean MEDSL · St. Louis
- 2024 margin
- Solid D (+64.7) · D 81.4% · R 16.7% · Other 2.0%
- 2008→2024 swing
- -3.5pp toward R · 2008: 68.2pp · 2024: 64.7pp
- All cycles
- 2024: D+64.7 2020: D+66.2 2016: D+63.7 2012: D+66.6 2008: D+68.2
Not yet ingested
- Civics
- —
Market trends
- HPI YoY
- ▼ -1.75%
- Current HPI
- 92.7423
- Rent YoY
- —
- Metro
- —
- State GDP YoY
- ▲ 1.84%
- F500 in state
- 20
Industry mix (Fortune 500 HQ in MO)
| Industry | F500 HQs | Revenue |
|---|---|---|
| Healthcare | 1 | $163B |
|
||
| Insurance | 1 | $21B |
|
||
| Industrial Technology | 1 | $17B |
|
||
| Retail | 1 | $16B |
|
||
| Industrial Distribution | 1 | $10B |
|
||
| Utilities | 1 | $9B |
|
||
Price history
4 events — show timeline
- 2026-05-05 Pending — MARIS as Distributed by MLS Grid
- 2026-04-28 Relisted — MARIS as Distributed by MLS Grid
- 2026-03-24 Pending — MARIS as Distributed by MLS Grid
- 2026-03-02 Listed $75,000 MARIS as Distributed by MLS Grid
Cash-flow waterfall
monthlySold comps — $/sqft
last 12 mo · ≤1 miLoading sold comps…