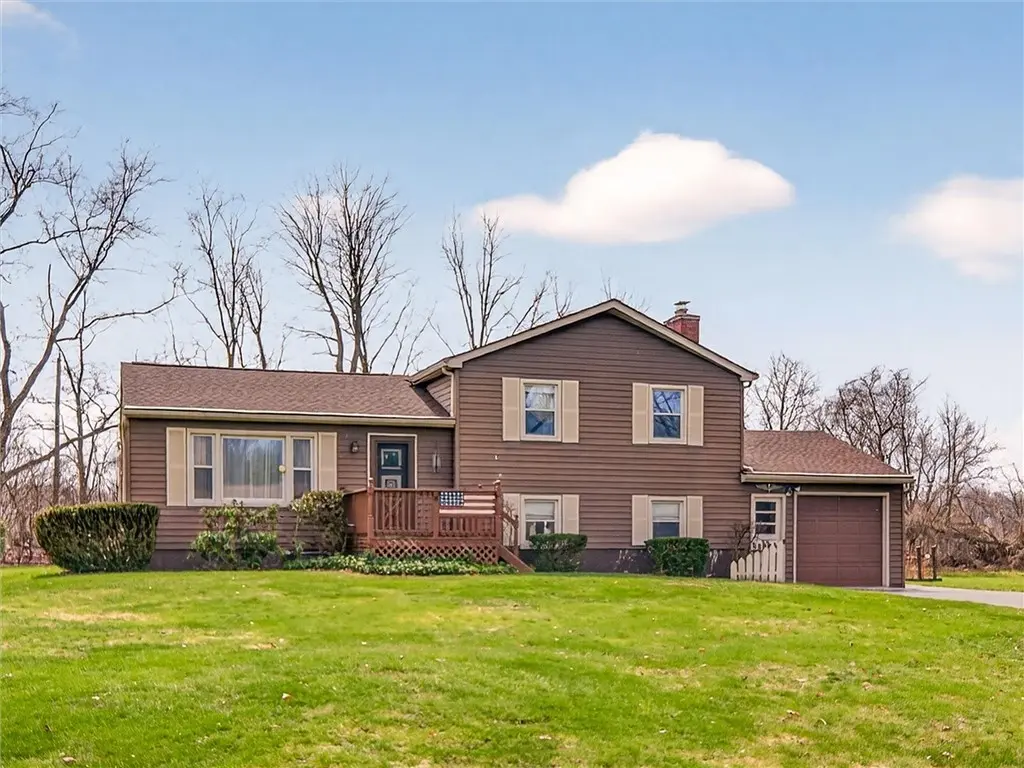
157 Garden Pkwy
Rochester Institute of Technology, NY 14467
$224,900D+
3 bd · 1.5 ba ·
1,539 sqft ·
Built 1959
· SingleFamily
· Pending
· 10 DOM
Cashflow @ list (25.0% down · 7.5%)
Estimated rent
$2,212/mo
Mortgage (P&I)
−$1,179
Tax + insurance
−$579
HOA
−$0
Vac / Maint / Mgmt
−$465
Net cashflow
$-11/mo
Annual
$-133/yr
Cap rate
6.23%
Cash-on-cash
-0.21%
DSCR
0.99
1% rule
0.98%
Cash to close
$62,972
Investor read
- This is a 3-bed/1.5-bath single-family listed at $225k.
- At list price, monthly cash flow is $-11 ($-133/yr) — negative.
- To cash-flow at today's rent, offer at most $223k (0.9% below list).
- To meet the 1% rule (rent ≥ 1% of price), the offer needs to be $221k (1.6% below list).
- Only 10 days on market — expect competitive offers; lowballing is unlikely to land.
- Recommended offer: $221k (1.6% below list) — sets the bar for 1% rule.
- Local home prices are declining (-3.0%/yr); year-one equity from $2k of loan paydown is wiped out by about $7k of value loss. Plan a longer hold.
- Location reads: area grade D — affects rentability + tenant quality, not the cash-flow math above.
- Rush-Henrietta Central School District (suburban): math 62% / reading 57% proficiency, ranked #237 of 590 in NY (top 40%) — acceptable for families but not a draw, mixed tenant base, ~2y average lease.
- Watch-outs: property tax is 2.6% of price; built in 1959 — expect roof / HVAC / electrical / plumbing capex.
- Market conditions: Rents rising (+1.3%/yr); 39 active listings in the ZIP; 6 comparable units currently listed for rent nearby; rentals leasing fast (median 12d on market — plan ~1-2 weeks tenant-placement turnaround); solid renter incomes; 1,169 units permitted in Monroe County in 2024 (591 in 5+ unit buildings).
- Monroe County population projected to shrink 6% by 2050 — rents likely to lag national; underwrite the cash flow, not the appreciation.
- Cap rate 6.2% vs local median 3.8% in Rochester Institute of Technology — top-decile yield for the area; either an underpriced asset or a hidden risk that comps aren't pricing in. Stress-test before assuming the spread holds.
Questions for listing agent
- What do current leases actually rent for vs. the listed asking? Can we see a recent rent roll and the last 12 months of T-12 income?
- Built in 1959 — when were the roof, HVAC, electrical panel, plumbing, and water heater last replaced?
- Property tax is high relative to price — has the assessment been appealed recently, and will the sale trigger a re-assessment?
- Is there a deadline driving the sale (1031 exchange, divorce, estate, relocation)? That informs how much negotiation room exists.
- The area grade is low — what's the realistic commute time and amenity access for the typical tenant pool here? Any planned neighborhood developments (good or bad) we should know about?
- What's the average days-on-market for RENTAL listings here right now (not sales)? A rising rental-DOM trend means longer vacancies and softer asking-rent achievability than the comps imply.
- What's the recent tenant-quality profile in this submarket — average credit score on applications, eviction rate, late-payment / NSF rate, and stable-employment percentage? A property-management company in the area should have these aggregated.
- How much new for-sale + rental construction is in the pipeline within 1–3 miles? Heavy new supply typically softens prices + rents 12–24 months out; constrained supply supports both.
CashFlowRE · CFR-6P7MMH1AT0V4EC
· Data 3 weeks ago
cashflowre.app · 2026-05-29