157 Garden Pkwy · Rochester Institute of Technology, NY
Flood risk 1/10 · Minimal
- FEMA flood zone
- X (unshaded)
- Chance of flooding over 30 yrs
- 0.0%
- Est. flood insurance / yr
- $473 – $860
Fire risk 2/10 · Minimal
- Est. fire insurance / yr
- $691 – $1,283
Heat risk 2/10 · Minimal
- Hot days now (above 94°F)
- 7 days/yr
- Hot days in 30 yrs
- 15 days/yr
Wind risk 1/10 · Minimal
- Chance of severe wind over 30 yrs
- —
Air-quality risk 2/10 · Minimal
- Unhealthy air days now
- 1 days/yr
- Unhealthy air days in 30 yrs
- 1 days/yr
Risk factors via First Street. Map © Google.
Why this score? — see what drove the D+ grade
The composite is a weighted blend of 9 inputs, each scored 0–100. Each bar is that input's sub-score; the figure is the points it added to the 100-point composite (weight × sub-score).
- ARV discount +15.0/15.0
- Cash flow +13.0/30.0
- Schools +5.2/10.0
- 1% rule +4.8/10.0
- DSCR +3.9/10.0
- Rent growth +2.8/5.0
- Livability +2.5/5.0
- Condition / age +2.5/5.0
- Appreciation +0.0/10.0
$224,900
🖨 Deal sheet 📄 Offer letter ✓ Due diligence
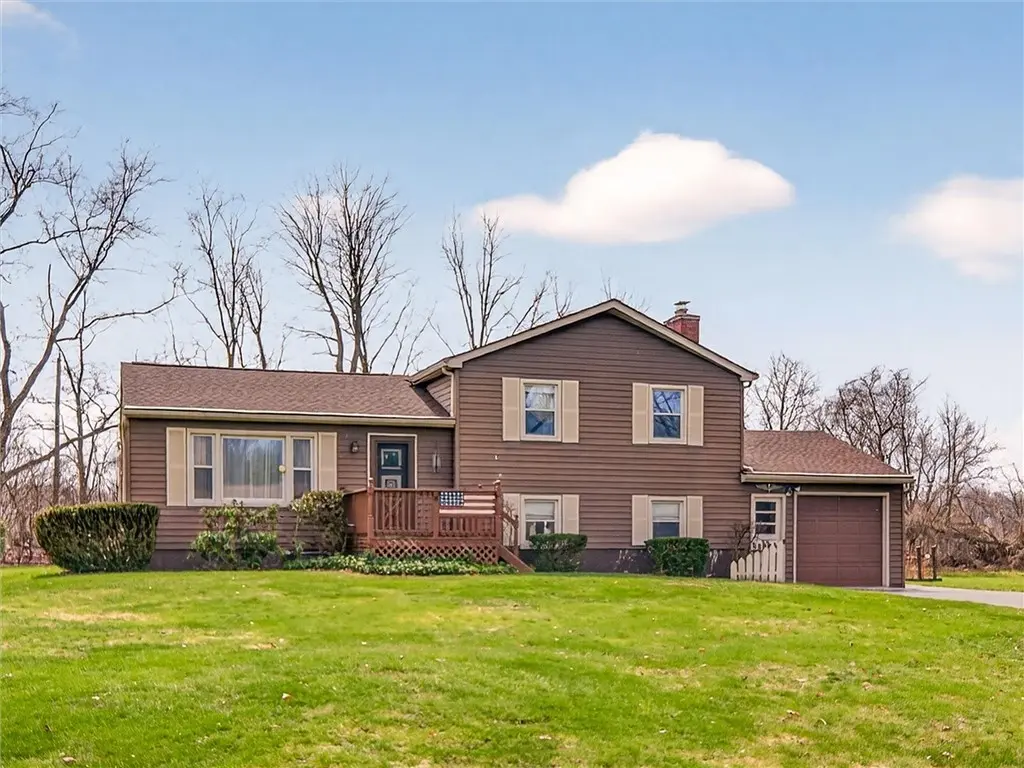
Listing remarks
Henrietta Priced to Sell and Move-in Ready! Our home is ready for the next lucky owners to make it their own "Home Sweet Home"! Wonderful split level with over 1500 sqft of living space on a 0.38+ acre lot located on a cul-de-sac street. This home offers the following features: Hardwood Floors, Gas Fireplace in the family room with Powder Room. New Roof 2024 with 30 year transferable warranty, New Furnace 2025, Generac Generator 2019, recently redecorated and painted interior. Exterior is Maintenance Free Aluminum Clad Lifetime Siding. Location, Location, Location: walk to RH Junior High school (0.5 miles) all of the other RH Schools are 3 miles or less away. Minutes to I90, Rt 3
Key facts
- New furnace
- Generac generator
- Gas fireplace
Tags
Property features AI
Exterior
- Parking: Attached garage with 1 garage space; Driveway; Garage door opener; Garage with electricity
- Utilities: Electricity connected with circuit breakers; Public water connected; Sewer connected; High-speed internet available; Cable available
- Home design: Two-story house; Existing/resale property
- Construction: Aluminum siding; Copper plumbing; Asphalt roof; Block foundation
- Exterior features: Blacktop driveway; Deck; Open patio and porch; Porch; Shed(s) / exterior storage
Interior
- Kitchen: Gas oven; Gas range; Dishwasher; Refrigerator
- Bedrooms: Total rooms include living spaces, family room, recreation area and laundry (7 total rooms)
- Flooring: Carpet; Hardwood; Resilient flooring; Varied flooring types
- Bathrooms: 1 full bathroom; 1 half bathroom
- Heating & cooling: Gas forced-air heating; Central air conditioning
- Interior features: Separate/formal living room; Living/dining room; Window treatments and drapes; Storm and thermal windows; Programmable thermostat; Generator
- Laundry & utility: Washer and dryer; Laundry located in basement; Gas water heater; Humidifier
Neighborhood map
What this means for you Summary
Snapshot
- This is a 3-bed/1.5-bath single-family listed at $225k.
Deal economics
- At list price, monthly cash flow is $-11 ($-133/yr) — negative.
- To cash-flow at today's rent, offer at most $223k (0.9% below list).
- To meet the 1% rule (rent ≥ 1% of price), the offer needs to be $221k (1.6% below list).
- Recommended offer: $221k (1.6% below list) — sets the bar for 1% rule.
- Cap rate 6.2% vs local median 3.8% in Rochester Institute of Technology — top-decile yield for the area; either an underpriced asset or a hidden risk that comps aren't pricing in. Stress-test before assuming the spread holds.
Location & tenants
- Location reads: area grade D — affects rentability + tenant quality, not the cash-flow math above.
- Rush-Henrietta Central School District (suburban): math 62% / reading 57% proficiency, ranked #237 of 590 in NY (top 40%) — acceptable for families but not a draw, mixed tenant base, ~2y average lease.
- Market conditions: Rents rising (+1.3%/yr); 39 active listings in the ZIP; 6 comparable units currently listed for rent nearby; rentals leasing fast (median 11d on market — plan ~1-2 weeks tenant-placement turnaround); solid renter incomes; 1,169 units permitted in Monroe County in 2024 (591 in 5+ unit buildings).
Forward outlook
- Local home prices are declining (-3.0%/yr); year-one equity from $2k of loan paydown is wiped out by about $7k of value loss. Plan a longer hold.
- Monroe County population projected to shrink 6% by 2050 — rents likely to lag national; underwrite the cash flow, not the appreciation.
Negotiation context
- Only 10 days on market — expect competitive offers; lowballing is unlikely to land.
Risks & watch-outs
- Watch-outs: property tax is 2.6% of price; built in 1959 — expect roof / HVAC / electrical / plumbing capex.
Questions for the listing agent
- What do current leases actually rent for vs. the listed asking? Can we see a recent rent roll and the last 12 months of T-12 income?
- Built in 1959 — when were the roof, HVAC, electrical panel, plumbing, and water heater last replaced?
- Property tax is high relative to price — has the assessment been appealed recently, and will the sale trigger a re-assessment?
- Is there a deadline driving the sale (1031 exchange, divorce, estate, relocation)? That informs how much negotiation room exists.
- The area grade is low — what's the realistic commute time and amenity access for the typical tenant pool here? Any planned neighborhood developments (good or bad) we should know about?
- What's the average days-on-market for RENTAL listings here right now (not sales)? A rising rental-DOM trend means longer vacancies and softer asking-rent achievability than the comps imply.
- What's the recent tenant-quality profile in this submarket — average credit score on applications, eviction rate, late-payment / NSF rate, and stable-employment percentage? A property-management company in the area should have these aggregated.
- How much new for-sale + rental construction is in the pipeline within 1–3 miles? Heavy new supply typically softens prices + rents 12–24 months out; constrained supply supports both.
Investment metrics
- 1% rule
- 0.98% ✗
- Cap rate
- 6.23%
- Cash-on-cash
- -0.21%
- DSCR
- 0.99
- GRM
- 8.5
CMA / ARV
- ARV (on-the-fly)
- $312,417
- Comps found
- 12
Show comp detail 12 sales within ~0.75 mi
| Address | Dist | Beds/Ba | Sqft | Sold | Price | $/sf | Match |
|---|---|---|---|---|---|---|---|
| 157 Garden Pkwy | 0.00mi | 3/1.5 | 1,539 (0%) | 1mo | $310,000 | $201 | 100 |
| 197 Garden Pkwy | 0.10mi | 3/2.0 | 1,538 (-0%) | 3mo | $380,000 | $247 | 91 |
| 45 Marberth Dr | 0.48mi | 3/1.5 | 1,560 (+1%) | 0mo | $290,000 | $186 | 75 |
| 16 Mertensia Ln | 0.16mi | 3/2.0 | 1,540 (+0%) | 21mo | $300,000 | $195 | 73 |
| 31 Justinshire Dr | 0.49mi | 3/1.5 | 1,520 (-1%) | 8mo | $330,000 | $217 | 68 |
| 4 Windelin Dr | 0.21mi | 3/2.5 | 1,683 (+9%) | 9mo | $340,000 | $202 | 63 |
| 5 Marberth Dr | 0.55mi | 4/2.0 (+1) | 1,508 (-2%) | 7mo | $310,000 | $206 | 58 |
| 8 Trailhead Rd | 0.58mi | 3/2.5 | 1,440 (-6%) | 1mo | $425,000 | $295 | 57 |
| 60 Marberth Dr | 0.42mi | 3/1.5 | 1,664 (+8%) | 13mo | $311,000 | $187 | 56 |
| 143 Detroit Trl | 0.59mi | 3/1.5 | 1,686 (+10%) | 3mo | $295,000 | $175 | 54 |
| 41 Wallman Dr | 0.60mi | 4/1.5 (+1) | 1,440 (-6%) | 3mo | $292,500 | $203 | 54 |
| 259 Nevins Rd | 0.69mi | 3/2.5 | 1,440 (-6%) | 4mo | $400,000 | $278 | 50 |
Match score weights: distance 35% · size 25% · config 20% · recency 20%. Top-matched comps best support the ARV.
Projected returns pro-forma
-3.0% appreciation · 1.28% rent growth · sell at horizon
- IRR
- -18.8%
- Equity multiple
- 0.35×
- Total profit
- $-40,753
- Equity at exit
- $33,533
- IRR
- -15.6%
- Equity multiple
- 0.20×
- Total profit
- $-50,668
- Equity at exit
- $19,445
Cash invested: $62,972 (down + closing). Projections, not guarantees.
Landlord ↔ Tenant lean methodology
- Overall (STATE)
- 15 Strongly Tenant-Friendly
- State New York
- 15 Strongly Tenant-Friendly · D+10
- County
- — inherits STATE
- City
- — inherits STATE
ZIP-level market 14467
- Home prices YoY
- -13.8%
- Rents YoY
- 1.3%
- Active inventory
- 39
- Price-to-rent
- 8.5×
Monthly cashflow live
- Estimated rent
- $2,212 high interval (Pro) →
- Mortgage (P&I)
- −$1,179
- Tax from tax record
- −$485 /mo · $5,825/yr
- Insurance
- −$94
- HOA
- −$0
- Vacancy / Maint / Mgmt
- −$465
- Net cashflow
- $-11
Break-even live
UW: 25.0% down · 7.5% · 30yr · 1.5% tax · 5.0% vac · 8.0% maint · 8.0% mgmt
Financing live
Cash to close
- Down payment
- $56,225
- Closing costs
- $6,747
- Reserves months
- —
- Total cash needed
- —
Loan-product check · same deal, 3 products live
Conventional
25% down · 7.5% · 30yr
- Down + closing
- —
- Monthly P&I
- —
- Monthly cashflow
- —
- DSCR
- —
- Eligible?
- —
Personal DTI + credit; lowest rate.
DSCR
20% down · 8.5% · 30yr
- Down + closing
- —
- Monthly P&I
- —
- Monthly cashflow
- —
- DSCR
- —
- Eligible?
- —
No personal income docs; deal must DSCR.
Hard money
10% down · 12.0% · 12mo
- Down + closing
- —
- Monthly P&I
- —
- Monthly cashflow
- —
- DSCR
- —
- Eligible?
- —
Short-term bridge; refi at stabilization.
Rent comps 6 comps
| Address | Beds | Baths | Sqft | Rent | $/sqft | DOM | Units | Dist |
|---|---|---|---|---|---|---|---|---|
| 0 Traditions Pl Henrietta, NY | 2.0 | 2.0 | 2000 | $2,700 | $1.35 | 43d | 1 | 0.21mi |
| 89 Erie Ridge Dr Henrietta, NY | 2.0 | 2.0 | 1165 | $2,495 | $2.14 | 2d | 1 | 0.22mi |
| 410 Erie Ridge Dr Henrietta, NY | 2.0 | 2.0 | 1157 | $2,275 | $1.97 | 43d | 1 | 0.27mi |
| 41 High Manor Dr Henrietta, NY | 1.0–2.0 | 1.0 | 950 | $1,695 | $1.78 | 2d | 19 | 0.58mi |
| 55 Agar Ave Henrietta, NY | 3.0 | 1.0 | 1728 | $2,350 | $1.36 | 11d | 1 | 0.90mi |
| 142 Prentiss Way Unit 1 Henrietta, NY | 3.0 | 1.0 | 1368 | $2,000 | $1.46 | 11d | 1 | 0.92mi |
Listing history 2 events
-
2026-04-19status Pending
-
2026-04-09$224,900 Active
ⓘ Source: listings_history table (triggers on properties + properties_extension) + one-shot
backfill from property_details.listing_events for pre-trigger history.
Tax reassessment forecast NY · Partial reset (capped growth)
- Current annual tax
- $5,825 · $485/mo
- Projected year-2 tax
- $5,825 · $485/mo
- Expected delta
- $0/yr ($0/mo · 0.0%)
ⓘ Screening estimate from a state-policy table — verify with the county assessor before closing.
Climate risk First Street
- Flood 1/10 Low FEMA zone X (unshaded) · 0% chance over 30 yrs
- Wildfire 2/10 Low
- Heat 2/10 Low 7 d/yr ≥94°F today · 15 d/yr by 30 yrs out
- Wind 1/10 Low
- Air quality 2/10 Low 1 unhealthy d/yr today · 1 by 30 yrs out
Nearby sold comps map
Loading sold comps map…
Walkable amenities ~0.75 mi
Loading nearby amenities…
Taxation est. · year 1
- Rental income
- $26,544
- − Mortgage interest
- −$12,598
- − Property taxes
- −$5,825
- − Insurance
- −$1,124
- − Repairs & maintenance
- −$2,124
- − Management
- −$2,124
- − Depreciation
- −$6,543
- Taxable loss
- −$3,793
- Est. tax savings @ 24.0%
- +$910
- After-tax cash flow
- $778/yr
For passive investors: Depreciation is non-cash, so a rental often shows a tax loss while cash-flowing — sheltering income. Rental losses are passive: they offset passive income freely, and up to $25,000/yr can offset ordinary (W-2) income if you actively participate and your MAGI is under $100k (phasing out to $0 by $150k); unused losses carry forward. On sale, claimed depreciation is recaptured at up to 25%, and gains may owe capital-gains tax (a 1031 exchange can defer both). Figures are a year-1 estimate at your 24.0% rate — not tax advice; consult a CPA.
Schools (NCES district)
- District
- Rush-Henrietta Central School District
- NCES district ID
- 3625170
- Math proficiency
- 62% ▼ -6.00%
- Reading proficiency
- 57% ▲ 1.00%
- Median HH income
- $58,682
- Composite
- 51.52/100
- National rank
- #1720
- State rank
- #237 of 590 in NY
Livability — Rochester Institute of Technology
No livability data for this city. (Only ~50 U.S. cities are tracked.)
Census & demographics
- County
- Monroe County · 674,131 people
- Metro
- Rochester, NY
- Population (ZIP)
- 10,168
- Household income
- $88,653
- Rent vs Own
- Severe rent burden
- 265.0
Population outlook (Monroe County) Hauer SSP2
- Today (2025)
- 759,460 people
- By 2030
- 757,154 · -0.3%
- By 2040
- 740,644 · -2.5%
- By 2050
- 714,443 · -5.9%
- By 2075
- 645,883 · -15.0%
- By 2100
- 547,084 · -28.0%
Race, ethnicity, and origin ACS 2023
- Neighborhood character
- Predominantly White (77%)
- Race & ethnicity
- White 77% Asian 9% Black 6% Hispanic / Latino 5% Two or more races 4%
- Hispanic origin (detail)
- Puerto Rican 4%
- Common ancestry
- Romanian 7% Lithuanian 2% Slovak 2%
- Foreign-born
- 11% · China, Canada, Vietnam
- Languages at home
- 90% English-only · Other Indo-European 2% Arabic 2% Chinese 1%
Political lean MEDSL · Monroe
- 2024 margin
- D (+19.1) · D 59.5% · R 40.5%
- 2008→2024 swing
- +1.4pp toward D · 2008: 17.7pp · 2024: 19.1pp
- All cycles
- 2024: D+19.1 2020: D+21.0 2016: D+14.1 2012: D+17.4 2008: D+17.7
Not yet ingested
- Civics
- —
Market trends
- HPI YoY
- ▼ -44.47%
- Current HPI
- 276.5057
- Rent YoY
- ▲ 1.28%
- Metro
- Rochester, NY
- State GDP YoY
- ▲ 2.60%
- F500 in state
- 92
Industry mix (Fortune 500 HQ in NY)
| Industry | F500 HQs | Revenue |
|---|---|---|
| Financial Services | 10 | $950B |
|
||
| Consumer Goods | 9 | $162B |
|
||
| Insurance | 4 | $225B |
|
||
| Telecommunications | 2 | $144B |
|
||
| Pharmaceuticals | 2 | $112B |
|
||
| Media / Entertainment | 2 | $69B |
|
||
Price history
2 events — show timeline
- 2026-04-19 Pending — UNYREIS
- 2026-04-09 Listed $224,900 UNYREIS
Property tax history
+9.8%/yrLatest (2025): $5,825 · +28.8% YoY. Source: county tax records.
Cash-flow waterfall
monthlySold comps — $/sqft
last 12 mo · ≤1 miLoading sold comps…