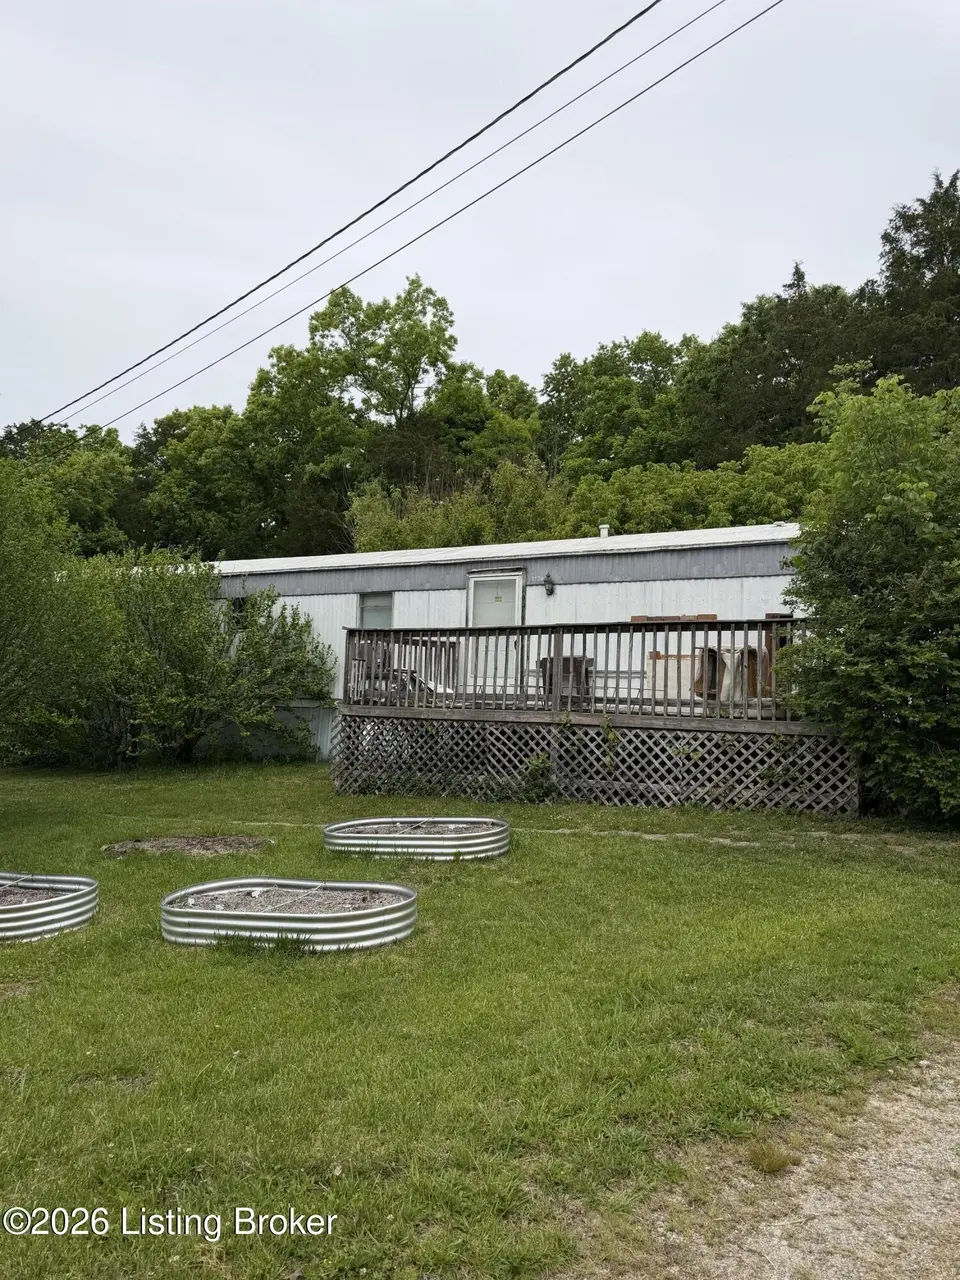
2976 Pottershop Rd #2970
Bardstown, KY 40004
$99,900B+
3 bd · 2.0 ba ·
1,280 sqft ·
Built 1998
· SingleFamily
· Pending
· 2 DOM
Cashflow @ list (25.0% down · 7.5%)
Estimated rent
$1,456/mo
Mortgage (P&I)
−$524
Tax + insurance
−$131
HOA
−$0
Vac / Maint / Mgmt
−$306
Net cashflow
$496/mo
Annual
$5,948/yr
Cap rate
12.25%
Cash-on-cash
21.26%
DSCR
1.95
1% rule
1.46%
Cash to close
$27,972
Investor read
- This is a 3-bed/2.0-bath single-family listed at $100k.
- At list price, monthly cash flow is $496 ($6k/yr) — positive.
- The deal already cash-flows at list — no discount required.
- Meets the 1% rule at list price ($1k rent vs $100k).
- Only 2 days on market — expect competitive offers; lowballing is unlikely to land.
- Local home prices are declining (-3.0%/yr); year-one equity from $691 of loan paydown is wiped out by about $3k of value loss. Plan a longer hold.
- Location reads 71/100 on livability (#145 in KY) — a middle-class / working-renter tenant base. Strengths: cost of living A+, housing A+, health & safety A+; Watch: employment C-, amenities F, commute F.
- Nelson County (rural): math 23% / reading 36% proficiency, ranked #97 of 165 in KY (top 59%) — low school quality limits family demand, transient renter base, plan for 1-2y turnover.
- Zoned schools: Foster Heights Elementary School (math 12% / reading 27%, grade F, #572 of 676 statewide, top 88%, 674 students, 44% FRL); Old Kentucky Home Middle School (math 14% / reading 36%, grade F, #184 of 217 statewide, top 87%, 368 students, 40% FRL); Nelson County High School (math 22% / reading 37%, grade F, #127 of 254 statewide, top 58%, 784 students, 42% FRL) — zoned schools at 42% FRL track the district average.
- Market conditions: 246 active listings in the ZIP; 210 units permitted in Nelson County in 2024 (15 in 5+ unit buildings).
- Nelson County population projected at +8% by 2050 — modest demand growth; plan on rents tracking national, not racing it.
- Current owner paid $58k; list at $100k implies a 72% gain — meaningful room to come down on a strong offer.
- At projected returns (-3.0% appreciation + 3.0% rent growth), your $28k cash investment doubles in ~6 years — after that, you're playing with house money.
- Cap rate 12.2% vs local median 3.1% in Bardstown — top-decile yield for the area; either an underpriced asset or a hidden risk that comps aren't pricing in. Stress-test before assuming the spread holds.
Questions for listing agent
- Is there a deadline driving the sale (1031 exchange, divorce, estate, relocation)? That informs how much negotiation room exists.
- Schools are D-rated, which usually means shorter tenancies and higher turnover. Who's the typical renter profile here, and what's been the actual vacancy rate?
- What's the average days-on-market for RENTAL listings here right now (not sales)? A rising rental-DOM trend means longer vacancies and softer asking-rent achievability than the comps imply.
- What's the recent tenant-quality profile in this submarket — average credit score on applications, eviction rate, late-payment / NSF rate, and stable-employment percentage? A property-management company in the area should have these aggregated.
- How much new for-sale + rental construction is in the pipeline within 1–3 miles? Heavy new supply typically softens prices + rents 12–24 months out; constrained supply supports both.
CashFlowRE · CFR-6PGCBHDA9XXMQD
· Data 3 weeks ago
cashflowre.app · 2026-05-29