2976 Pottershop Rd #2970 · Bardstown, KY
Flood risk 1/10 · Minimal
- FEMA flood zone
- X (unshaded)
- Chance of flooding over 30 yrs
- 0.0%
- Est. flood insurance / yr
- $473 – $860
Fire risk 4/10 · Minor
- Est. fire insurance / yr
- $839 – $1,559
Heat risk 4/10 · Minor
- Hot days now (above 105°F)
- 7 days/yr
- Hot days in 30 yrs
- 19 days/yr
Wind risk 2/10 · Minimal
- Chance of severe wind over 30 yrs
- 3.0%
Air-quality risk 2/10 · Minimal
- Unhealthy air days now
- 0 days/yr
- Unhealthy air days in 30 yrs
- 1 days/yr
Risk factors via First Street. Map © Google.
Why this score? — see what drove the B+ grade
The composite is a weighted blend of 9 inputs, each scored 0–100. Each bar is that input's sub-score; the figure is the points it added to the 100-point composite (weight × sub-score).
- Cash flow +30.0/30.0
- ARV discount +15.0/15.0
- DSCR +10.0/10.0
- 1% rule +9.6/10.0
- Livability +3.6/5.0
- Schools +2.6/10.0
- Rent growth +2.5/5.0
- Condition / age +2.5/5.0
- Appreciation +0.0/10.0
$99,900
🖨 Deal sheet (PDF) 📄 Offer letter ✓ Due diligence
Listing remarks
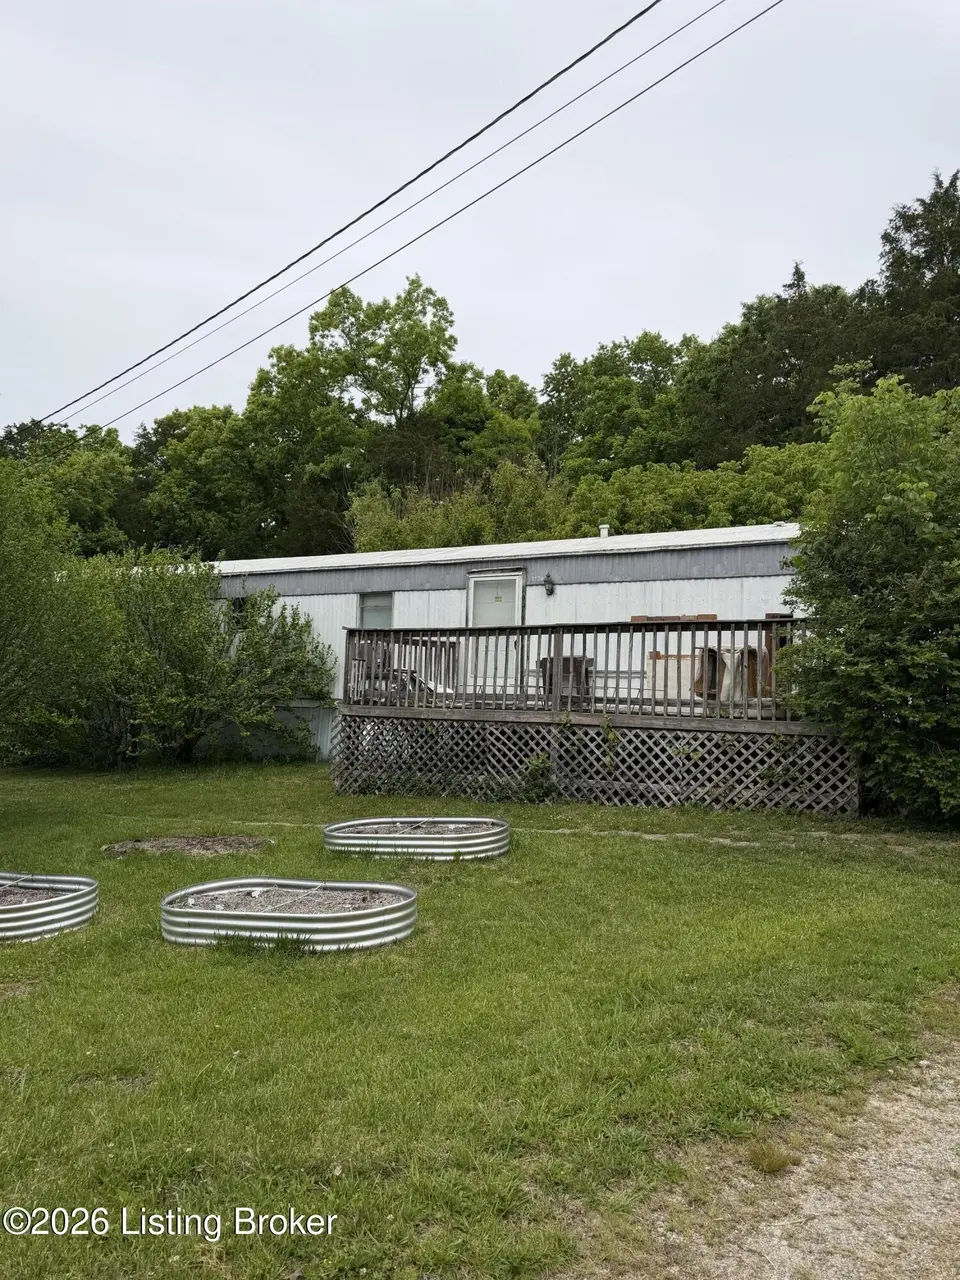
Beautiful 5.6 acre tract with two mobile homes that need work.
Key facts
- 5.6 acre lot
- Parking
- Built 1998
Property features AI
Finance
- HOA & community: No association fee
Exterior
- Parking: Driveway
- Utilities: Electricity connected
- Home design: Single-story residential home; Built in 1998; Entry level: first floor
- Construction: Aluminum siding; Metal roof; Built in 1998
- Exterior features: Wooded lot; Waterfront on the property
Interior
- Kitchen: Kitchen on the first floor
- Bedrooms: Three bedrooms, all on the first floor
- Bathrooms: Two full bathrooms
- Heating & cooling: Electric heating with a heat pump; Central air conditioning
- Interior features: First-floor primary bedroom; Living room on the first floor; First-floor laundry; No basement; Total of 5 rooms
- Laundry & utility: Laundry located on the first floor
Neighborhood map
What this means for you Summary
Snapshot
- This is a 3-bed/2.0-bath single-family listed at $100k.
Deal economics
- At list price, monthly cash flow is $496 ($6k/yr) — positive.
- The deal already cash-flows at list — no discount required.
- Meets the 1% rule at list price ($1k rent vs $100k).
- Cap rate 12.2% vs local median 3.1% in Bardstown — top-decile yield for the area; either an underpriced asset or a hidden risk that comps aren't pricing in. Stress-test before assuming the spread holds.
Location & tenants
- Location reads 71/100 on livability (#145 in KY) — a middle-class / working-renter tenant base. Strengths: cost of living A+, housing A+, health & safety A+; Watch: employment C-, amenities F, commute F.
- Nelson County (rural): math 23% / reading 36% proficiency, ranked #97 of 165 in KY (top 59%) — low school quality limits family demand, transient renter base, plan for 1-2y turnover.
- Zoned schools: Foster Heights Elementary School (math 12% / reading 27%, grade F, #572 of 676 statewide, top 88%, 674 students, 44% FRL); Old Kentucky Home Middle School (math 14% / reading 36%, grade F, #184 of 217 statewide, top 87%, 368 students, 40% FRL); Nelson County High School (math 22% / reading 37%, grade F, #127 of 254 statewide, top 58%, 784 students, 42% FRL) — zoned schools at 42% FRL track the district average.
- Market conditions: 246 active listings in the ZIP; 210 units permitted in Nelson County in 2024 (15 in 5+ unit buildings).
Forward outlook
- Local home prices are declining (-3.0%/yr); year-one equity from $691 of loan paydown is wiped out by about $3k of value loss. Plan a longer hold.
- Nelson County population projected at +8% by 2050 — modest demand growth; plan on rents tracking national, not racing it.
- At projected returns (-3.0% appreciation + 3.0% rent growth), your $28k cash investment doubles in ~6 years — after that, you're playing with house money.
Negotiation context
- Only 2 days on market — expect competitive offers; lowballing is unlikely to land.
- Current owner paid $58k; list at $100k implies a 72% gain — meaningful room to come down on a strong offer.
Questions for the listing agent
- Is there a deadline driving the sale (1031 exchange, divorce, estate, relocation)? That informs how much negotiation room exists.
- Schools are D-rated, which usually means shorter tenancies and higher turnover. Who's the typical renter profile here, and what's been the actual vacancy rate?
- What's the average days-on-market for RENTAL listings here right now (not sales)? A rising rental-DOM trend means longer vacancies and softer asking-rent achievability than the comps imply.
- What's the recent tenant-quality profile in this submarket — average credit score on applications, eviction rate, late-payment / NSF rate, and stable-employment percentage? A property-management company in the area should have these aggregated.
- How much new for-sale + rental construction is in the pipeline within 1–3 miles? Heavy new supply typically softens prices + rents 12–24 months out; constrained supply supports both.
Investment metrics
- 1% rule
- 1.46% ✓
- Cap rate
- 12.25%
- Cash-on-cash
- 21.26%
- DSCR
- 1.95
- GRM
- 5.7
CMA / ARV
- ARV (on-the-fly)
- $175,360
- Comps found
- 1
Show comp detail 1 sale within ~0.75 mi
| Address | Dist | Beds/Ba | Sqft | Sold | Price | $/sf | Match |
|---|---|---|---|---|---|---|---|
| 670 Greer Ln | 0.42mi | 3/1.0 | 1,164 (-9%) | 20mo | $160,000 | $137 | 45 |
Match score weights: distance 35% · size 25% · config 20% · recency 20%. Top-matched comps best support the ARV.
Projected returns pro-forma
-3.0% appreciation · 3.0% rent growth · sell at horizon
- IRR
- 13.8%
- Equity multiple
- 1.55×
- Total profit
- $15,379
- Equity at exit
- $14,895
- IRR
- 22.6%
- Equity multiple
- 2.93×
- Total profit
- $54,040
- Equity at exit
- $8,638
Cash invested: $27,972 (down + closing). Projections, not guarantees.
Landlord ↔ Tenant lean methodology
- Overall (STATE)
- 83 Strongly Landlord-Friendly
- State Kentucky
- 83 Strongly Landlord-Friendly · R+16
- County
- — inherits STATE
- City
- — inherits STATE
ZIP-level market 40004
- Home prices YoY
- -16.0%
- Active inventory
- 246
- Price-to-rent
- 5.7×
Monthly cashflow live
- Estimated rent
- $1,456 medium interval (Pro) →
- Mortgage (P&I)
- −$524
- Tax from tax record
- −$89 /mo · $1,068/yr
- Insurance
- −$42
- HOA
- −$0
- Vacancy / Maint / Mgmt
- −$306
- Net cashflow
- $496
Break-even live
Sensitivity live
| Price | -10% $552 | -5% $524 | +0% $496 | +5% $467 | +10% $439 |
|---|---|---|---|---|---|
| Rent | -10% $381 | -5% $438 | +0% $496 | +5% $553 | +10% $611 |
| Rate | -1.0pp $546 | -0.5pp $521 | base $496 | +0.5pp $470 | +1.0pp $443 |
UW: 25.0% down · 7.5% · 30yr · 1.5% tax · 5.0% vac · 8.0% maint · 8.0% mgmt
Financing live
Cash to close
- Down payment
- $24,975
- Closing costs
- $2,997
- Reserves months
- —
- Total cash needed
- —
Loan-product check · same deal, 3 products live
Conventional
25% down · 7.5% · 30yr
- Down + closing
- —
- Monthly P&I
- —
- Monthly cashflow
- —
- DSCR
- —
- Eligible?
- —
Personal DTI + credit; lowest rate.
DSCR
20% down · 8.5% · 30yr
- Down + closing
- —
- Monthly P&I
- —
- Monthly cashflow
- —
- DSCR
- —
- Eligible?
- —
No personal income docs; deal must DSCR.
Hard money
10% down · 12.0% · 12mo
- Down + closing
- —
- Monthly P&I
- —
- Monthly cashflow
- —
- DSCR
- —
- Eligible?
- —
Short-term bridge; refi at stabilization.
Listing history 2 events
-
2026-05-22$99,900 Active
-
2005-12-01soldstatus $58,000
ⓘ Source: listings_history table (triggers on properties + properties_extension) + one-shot
backfill from property_details.listing_events for pre-trigger history.
Tax reassessment forecast KY · Resets to sale price
- Current annual tax
- $1,068 · $89/mo
- Projected year-2 tax
- $1,068 · $89/mo
- Expected delta
- $0/yr ($0/mo · 0.0%)
ⓘ Screening estimate from a state-policy table — verify with the county assessor before closing.
Climate risk First Street
- Flood 1/10 Low FEMA zone X (unshaded) · 0% chance over 30 yrs
- Wildfire 4/10 Moderate
- Heat 4/10 Moderate 7 d/yr ≥105°F today · 19 d/yr by 30 yrs out
- Wind 2/10 Low 3% chance of damaging wind over 30 yrs
- Air quality 2/10 Low 0 unhealthy d/yr today · 1 by 30 yrs out
Nearby sold comps map
Loading sold comps map…
Walkable amenities ~0.75 mi
Loading nearby amenities…
Taxation est. · year 1
- Rental income
- $17,471
- − Mortgage interest
- −$5,596
- − Property taxes
- −$1,068
- − Insurance
- −$500
- − Repairs & maintenance
- −$1,398
- − Management
- −$1,398
- − Depreciation
- −$2,906
- Taxable income
- $4,606
- Est. tax owed @ 24.0%
- −$1,105
- After-tax cash flow
- $4,842/yr
For passive investors: Depreciation is non-cash, so a rental often shows a tax loss while cash-flowing — sheltering income. Rental losses are passive: they offset passive income freely, and up to $25,000/yr can offset ordinary (W-2) income if you actively participate and your MAGI is under $100k (phasing out to $0 by $150k); unused losses carry forward. On sale, claimed depreciation is recaptured at up to 25%, and gains may owe capital-gains tax (a 1031 exchange can defer both). Figures are a year-1 estimate at your 24.0% rate — not tax advice; consult a CPA.
Schools (NCES district)
- District
- Nelson County
- NCES district ID
- 2104410
- Math proficiency
- 23% ▼ -17.00%
- Reading proficiency
- 36% ▼ -18.00%
- Median HH income
- $54,290
- Composite
- 26.15/100
- National rank
- #7274
- State rank
- #97 of 165 in KY
Livability — Bardstown
- Score
- 71/100
- State rank
- #145
- US rank
- #6811
Category grades
Schools grade is shown separately in the Schools card above.
Census & demographics
- County
- Nelson County · 30,601 people
- City population
- 30,601
- Metro
- Bardstown, KY
- Population (ZIP)
- 30,601
- Household income
- $66,578
- Rent vs Own
- Severe rent burden
- 795.0
Population outlook (Nelson County) Hauer SSP2
- Today (2025)
- 48,436 people
- By 2030
- 49,780 · +2.8%
- By 2040
- 51,737 · +6.8%
- By 2050
- 52,395 · +8.2%
- By 2075
- 52,271 · +7.9%
- By 2100
- 47,277 · -2.4%
Race, ethnicity, and origin ACS 2023
- Neighborhood character
- Predominantly White (87%)
- Race & ethnicity
- White 87% Black 7% Two or more races 3% Hispanic / Latino 3%
- Common ancestry
- Slovak 2% Italian 1% Lithuanian 1%
- Foreign-born
- 3% · Canada, United Kingdom
- Languages at home
- 96% English-only · Spanish 2% Russian/Polish/Slavic 0%
Political lean MEDSL · Nelson
- 2024 margin
- Solid R (+41.8) · D 28.5% · R 70.3% · Other 1.2%
- 2008→2024 swing
- -28.1pp toward R · 2008: -13.7pp · 2024: -41.8pp
- All cycles
- 2024: R+41.8 2020: R+36.6 2016: R+33.7 2012: R+16.5 2008: R+13.7
Not yet ingested
- Civics
- —
Market trends
- HPI YoY
- ▼ -52.14%
- Current HPI
- 272.9009
- Rent YoY
- —
- Metro
- Bardstown, KY
- State GDP YoY
- ▲ 1.81%
- F500 in state
- 4
Industry mix (Fortune 500 HQ in KY)
| Industry | F500 HQs | Revenue |
|---|---|---|
| Healthcare | 1 | $118B |
|
||
| Food / Beverage | 1 | $7B |
|
||
Price history
+72.2% since first listed2 events — show timeline
- 2026-05-22 Listed $99,900 Metro Search MLS
- 2005-12-01 Sold (Public Records) $58,000 Public Records
Property tax history
+8.0%/yrLatest (2025): $1,068 · +229.8% YoY. Source: county tax records.
Cash-flow waterfall
monthlySold comps — $/sqft
last 12 mo · ≤1 miLoading sold comps…