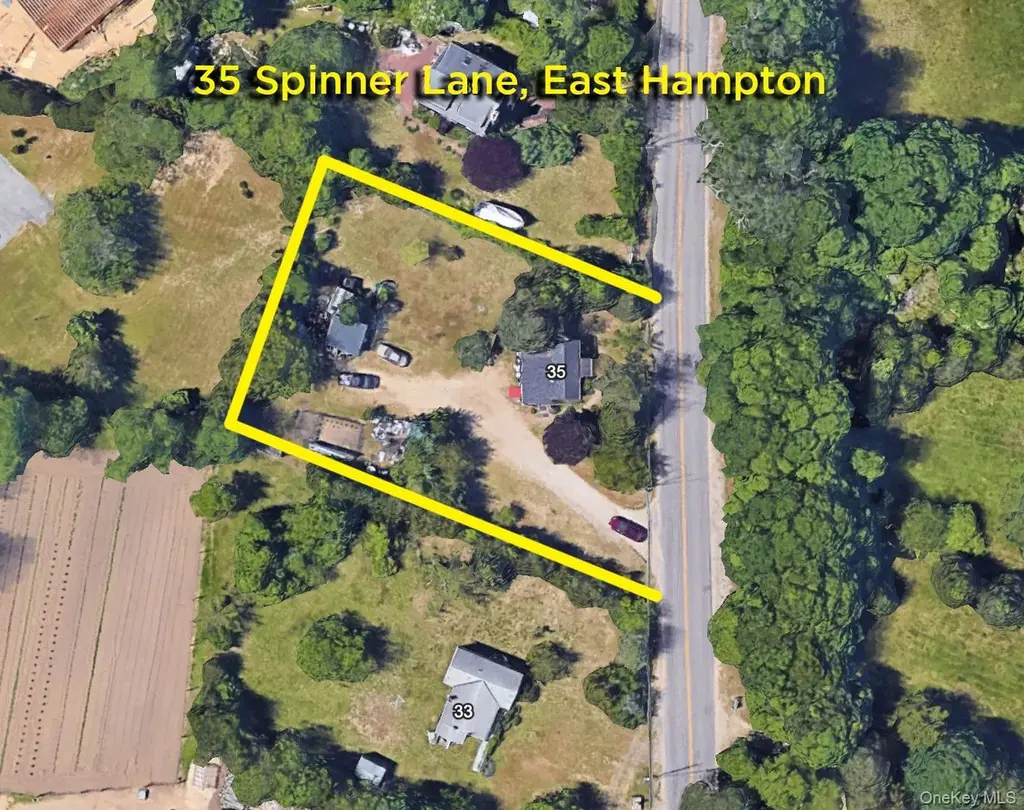
35 Spinner Ln
East Hampton North, NY 11937
$1,295,000C
2 bd · 1.0 ba ·
850 sqft ·
Built 1932
· SingleFamily
· Active
· 18 DOM
Cashflow @ list (25.0% down · 7.5%)
Estimated rent
$15,830/mo
Mortgage (P&I)
−$6,791
Tax + insurance
−$2,158
HOA
−$0
Vac / Maint / Mgmt
−$3,324
Net cashflow
$3,556/mo
Annual
$42,678/yr
Cap rate
9.59%
Cash-on-cash
11.77%
DSCR
1.52
1% rule
1.22%
Cash to close
$362,600
Investor read
- This is a 2-bed/1.0-bath single-family listed at $1.29M.
- At list price, monthly cash flow is $4k ($43k/yr) — positive.
- The deal already cash-flows at list — no discount required.
- Meets the 1% rule at list price ($16k rent vs $1.29M).
- It's been on market 18 days — a 2% lower offer ($1.28M) is reasonable based on typical stale-listing flexibility.
- Recommended offer: $1.28M (1.5% below list) — sets the bar for market timing.
- Local home prices are declining (-3.0%/yr); year-one equity from $9k of loan paydown is wiped out by about $39k of value loss. Plan a longer hold.
- Location reads 59/100 on livability (#1,013 in NY) — a working-class tenant base; expect higher turnover. Strengths: crime A+, employment A+; Watch: amenities F, commute F, cost of living F.
- East Hampton Union Free School District (town): math 62% / reading 66% proficiency, ranked #159 of 590 in NY (top 27%) — acceptable for families but not a draw, mixed tenant base, ~2y average lease.
- Zoned schools: John M Marshall Elementary School (math 57% / reading 62%, grade B-, #745 of 2,108 statewide, top 39%, 548 students, 51% FRL); East Hampton Middle School (math 39% / reading 60%, grade C, #280 of 729 statewide, top 40%, 265 students, 42% FRL); East Hampton High School (math 94% / reading 98%, grade A+, #71 of 1,100 statewide, top 7%, 1,015 students, 40% FRL) — zoned schools average 44% FRL vs 26% district-wide (18 pts higher); higher-poverty schools than district average — tighter screening recommended.
- Watch-outs: built in 1932 — expect roof / HVAC / electrical / plumbing capex.
- Market conditions: Rents rising fast (+12.3%/yr); 135 active listings in the ZIP; 3 comparable units currently listed for rent nearby; rentals leasing fast (median 0d on market — plan ~1-2 weeks tenant-placement turnaround); high-income renter base; 1,366 units permitted in Suffolk County in 2024 (216 in 5+ unit buildings).
- Suffolk County population projected to shrink 5% by 2050 — rents likely to lag national; underwrite the cash flow, not the appreciation.
- At projected returns (-3.0% appreciation + 8.0% rent growth), your $363k cash investment doubles in ~7 years — after that, you're playing with house money.
- At $15,830/mo this rent would consume 146% of the median local household income ($130k/yr) (locally 896% of renters already pay >50% of income on rent) — very limited rent-growth headroom before tenants either downsize or default.
Questions for listing agent
- Built in 1932 — when were the roof, HVAC, electrical panel, plumbing, and water heater last replaced?
- Is there a deadline driving the sale (1031 exchange, divorce, estate, relocation)? That informs how much negotiation room exists.
- Schools are D-rated, which usually means shorter tenancies and higher turnover. Who's the typical renter profile here, and what's been the actual vacancy rate?
- What's the average days-on-market for RENTAL listings here right now (not sales)? A rising rental-DOM trend means longer vacancies and softer asking-rent achievability than the comps imply.
- What's the recent tenant-quality profile in this submarket — average credit score on applications, eviction rate, late-payment / NSF rate, and stable-employment percentage? A property-management company in the area should have these aggregated.
- How much new for-sale + rental construction is in the pipeline within 1–3 miles? Heavy new supply typically softens prices + rents 12–24 months out; constrained supply supports both.
CashFlowRE · CFR-6Q3TBM8A96XS9E
· Data 1 day ago
cashflowre.app · 2026-05-29