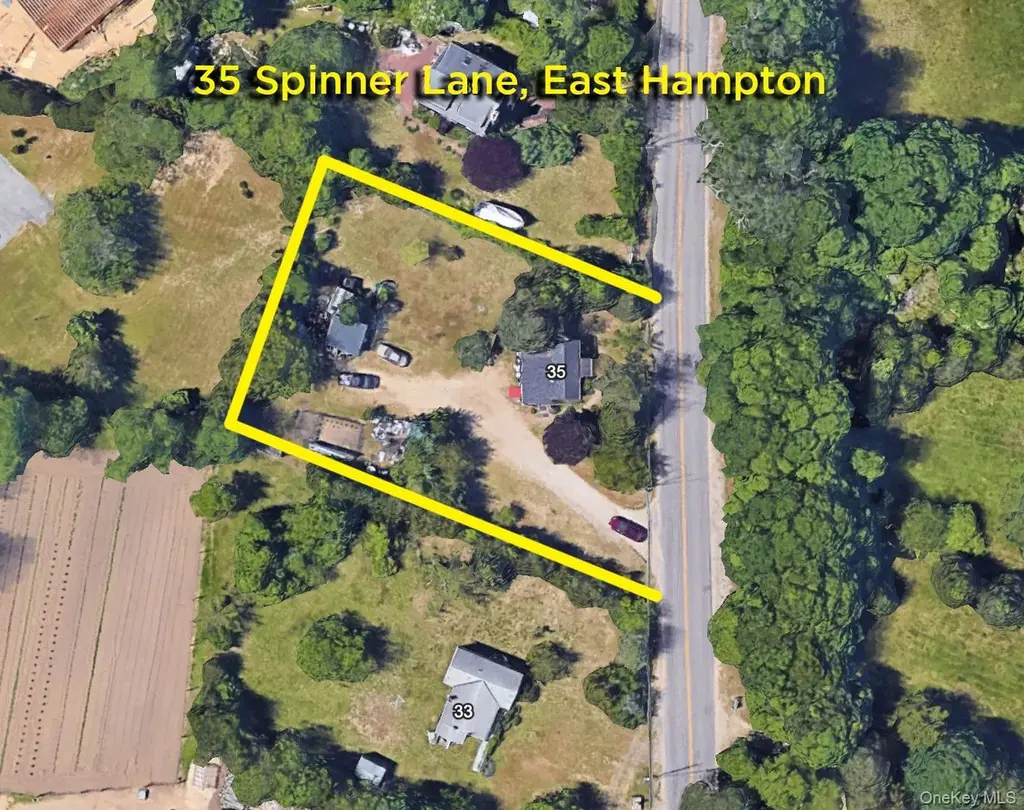
35 Spinner Ln · East Hampton North, NY
Flood risk No data
- FEMA flood zone
- —
- Chance of flooding over 30 yrs
- —
- Est. flood insurance / yr
- —
Fire risk No data
- Est. fire insurance / yr
- —
Heat risk No data
- Hot days now (above threshold)
- —
- Hot days in 30 yrs
- —
Wind risk No data
- Chance of severe wind over 30 yrs
- —
Air-quality risk No data
- Unhealthy air days now
- —
- Unhealthy air days in 30 yrs
- —
Risk factors via First Street. Map © Google.
Why this score? — see what drove the C grade
The composite is a weighted blend of 9 inputs, each scored 0–100. Each bar is that input's sub-score; the figure is the points it added to the 100-point composite (weight × sub-score).
- Cash flow +26.8/30.0
- DSCR +9.2/10.0
- 1% rule +7.2/10.0
- Schools +5.8/10.0
- Rent growth +5.0/5.0
- Livability +3.0/5.0
- Condition / age +2.5/5.0
- ARV discount +0.4/15.0
- Appreciation +0.0/10.0
$1,295,000
🖨 Deal sheet (PDF) 📄 Offer letter ✓ Due diligence
Listing remarks
Once-in-a-lifetime East Hampton land opportunity. 35 Spinner Lane presents a rare chance to secure a redevelopment site in a prime East Hampton location. With buildable land becoming increasingly scarce and opportunities like this few and far between, this property offers exceptional potential for builders, investors, and end users alike. Approved plans available upon request. Whether you're envisioning a custom Hamptons retreat, a luxury spec home, or a long-term investment, this is a rare opportunity to create something truly special in a market where land is one of the most limited resources.
Key facts
- Approved plans
- Redevelopment site
- Buildable land
Tags
Property features AI
Exterior
- Parking: Driveway access (no carport)
- Utilities: Electricity available; Water available; Sewer: Other
- Home design: Single family residence; Property condition: Fixer
- Construction: Frame construction
- Exterior features: Frame construction; Not waterfront
Interior
- Kitchen: No appliances listed
- Bedrooms: 3 total rooms (includes bedrooms and other rooms)
- Flooring: Other flooring
- Bathrooms: 1 full bathroom
- Heating & cooling: Heating described as 'See Remarks' / Other; No cooling
- Interior features: Other interior features; Basement with Bilco door(s) and additional details noted in remarks; Dormer attic
- Laundry & utility: Laundry features described as other
Neighborhood map
What this means for you Summary
Snapshot
- This is a 2-bed/1.0-bath single-family listed at $1.29M.
Deal economics
- At list price, monthly cash flow is $4k ($43k/yr) — positive.
- The deal already cash-flows at list — no discount required.
- Meets the 1% rule at list price ($16k rent vs $1.29M).
- Recommended offer: $1.28M (1.5% below list) — sets the bar for market timing.
Location & tenants
- Location reads 59/100 on livability (#1,013 in NY) — a working-class tenant base; expect higher turnover. Strengths: crime A+, employment A+; Watch: amenities F, commute F, cost of living F.
- East Hampton Union Free School District (town): math 62% / reading 66% proficiency, ranked #159 of 590 in NY (top 27%) — acceptable for families but not a draw, mixed tenant base, ~2y average lease.
- Zoned schools: John M Marshall Elementary School (math 57% / reading 62%, grade B-, #745 of 2,108 statewide, top 39%, 548 students, 51% FRL); East Hampton Middle School (math 39% / reading 60%, grade C, #280 of 729 statewide, top 40%, 265 students, 42% FRL); East Hampton High School (math 94% / reading 98%, grade A+, #71 of 1,100 statewide, top 7%, 1,015 students, 40% FRL) — zoned schools average 44% FRL vs 26% district-wide (18 pts higher); higher-poverty schools than district average — tighter screening recommended.
- Market conditions: Rents rising fast (+12.3%/yr); 135 active listings in the ZIP; 3 comparable units currently listed for rent nearby; rentals leasing fast (median 0d on market — plan ~1-2 weeks tenant-placement turnaround); high-income renter base; 1,366 units permitted in Suffolk County in 2024 (216 in 5+ unit buildings).
- At $15,830/mo this rent would consume 146% of the median local household income ($130k/yr) (locally 896% of renters already pay >50% of income on rent) — very limited rent-growth headroom before tenants either downsize or default.
Forward outlook
- Local home prices are declining (-3.0%/yr); year-one equity from $9k of loan paydown is wiped out by about $39k of value loss. Plan a longer hold.
- Suffolk County population projected to shrink 5% by 2050 — rents likely to lag national; underwrite the cash flow, not the appreciation.
- At projected returns (-3.0% appreciation + 8.0% rent growth), your $363k cash investment doubles in ~7 years — after that, you're playing with house money.
Negotiation context
- It's been on market 18 days — a 2% lower offer ($1.28M) is reasonable based on typical stale-listing flexibility.
Risks & watch-outs
- Watch-outs: built in 1932 — expect roof / HVAC / electrical / plumbing capex.
Questions for the listing agent
- Built in 1932 — when were the roof, HVAC, electrical panel, plumbing, and water heater last replaced?
- Is there a deadline driving the sale (1031 exchange, divorce, estate, relocation)? That informs how much negotiation room exists.
- Schools are D-rated, which usually means shorter tenancies and higher turnover. Who's the typical renter profile here, and what's been the actual vacancy rate?
- What's the average days-on-market for RENTAL listings here right now (not sales)? A rising rental-DOM trend means longer vacancies and softer asking-rent achievability than the comps imply.
- What's the recent tenant-quality profile in this submarket — average credit score on applications, eviction rate, late-payment / NSF rate, and stable-employment percentage? A property-management company in the area should have these aggregated.
- How much new for-sale + rental construction is in the pipeline within 1–3 miles? Heavy new supply typically softens prices + rents 12–24 months out; constrained supply supports both.
Investment metrics
- 1% rule
- 1.22% ✓
- Cap rate
- 9.59%
- Cash-on-cash
- 11.77%
- DSCR
- 1.52
- GRM
- 6.8
CMA / ARV
- ARV (on-the-fly)
- $1,118,600
- Comps found
- 1
Show comp detail 1 sale within ~0.75 mi
| Address | Dist | Beds/Ba | Sqft | Sold | Price | $/sf | Match |
|---|---|---|---|---|---|---|---|
| 140 Three Mile Harbor Rd | 0.46mi | 2/1.0 | 950 (+12%) | 3mo | $1,250,000 | $1,316 | 56 |
Match score weights: distance 35% · size 25% · config 20% · recency 20%. Top-matched comps best support the ARV.
Projected returns pro-forma
-3.0% appreciation · 8.0% rent growth · sell at horizon
- IRR
- 6.7%
- Equity multiple
- 1.28×
- Total profit
- $100,568
- Equity at exit
- $193,089
- IRR
- 20.1%
- Equity multiple
- 3.10×
- Total profit
- $760,986
- Equity at exit
- $111,968
Cash invested: $362,600 (down + closing). Projections, not guarantees.
Landlord ↔ Tenant lean methodology
- Overall (STATE)
- 15 Strongly Tenant-Friendly
- State New York
- 15 Strongly Tenant-Friendly · D+10
- County
- — inherits STATE
- City
- — inherits STATE
ZIP-level market 11937
- Rents YoY
- 12.3%
- Active inventory
- 135
- Price-to-rent
- 6.8×
Monthly cashflow live
- Estimated rent
- $15,830 medium interval (Pro) →
- Mortgage (P&I)
- −$6,791
- Tax est. 1.5%
- −$1,619 /mo · $19,425/yr
- Insurance
- −$540
- HOA
- −$0
- Vacancy / Maint / Mgmt
- −$3,324
- Net cashflow
- $3,556
Break-even live
Sensitivity live
| Price | -10% $4,451 | -5% $4,004 | +0% $3,556 | +5% $3,109 | +10% $2,662 |
|---|---|---|---|---|---|
| Rent | -10% $2,306 | -5% $2,931 | +0% $3,556 | +5% $4,182 | +10% $4,807 |
| Rate | -1.0pp $4,209 | -0.5pp $3,886 | base $3,556 | +0.5pp $3,221 | +1.0pp $2,880 |
UW: 25.0% down · 7.5% · 30yr · 1.5% tax · 5.0% vac · 8.0% maint · 8.0% mgmt
Financing live
Cash to close
- Down payment
- $323,750
- Closing costs
- $38,850
- Reserves months
- —
- Total cash needed
- —
Loan-product check · same deal, 3 products live
Conventional
25% down · 7.5% · 30yr
- Down + closing
- —
- Monthly P&I
- —
- Monthly cashflow
- —
- DSCR
- —
- Eligible?
- —
Personal DTI + credit; lowest rate.
DSCR
20% down · 8.5% · 30yr
- Down + closing
- —
- Monthly P&I
- —
- Monthly cashflow
- —
- DSCR
- —
- Eligible?
- —
No personal income docs; deal must DSCR.
Hard money
10% down · 12.0% · 12mo
- Down + closing
- —
- Monthly P&I
- —
- Monthly cashflow
- —
- DSCR
- —
- Eligible?
- —
Short-term bridge; refi at stabilization.
Rent comps 3 comps
| Address | Beds | Baths | Sqft | Rent | $/sqft | DOM | Units | Dist |
|---|---|---|---|---|---|---|---|---|
| 15 Amys Ln East Hampton, NY | 2.0 | 2.0 | 968 | $6,500 | $6.71 | 0d | 1 | 0.82mi |
| 66 Crystal Dr East Hampton, NY | 2.0 | 3.0 | 960 | $20,000 | $20.83 | 0d | 1 | 1.19mi |
| 319 Three Mile Harbor Rd East Hampton, NY | 2.0 | 1.0 | 1100 | $5,500 | $5.00 | 0d | 1 | 1.26mi |
Listing history 12 events
-
2026-06-21pricedays on market $1,295,000 Active 18 DOM
-
2026-06-18days on market $1,499,000 Active 15 DOM
-
2026-06-17days on market $1,499,000 Active 14 DOM
-
2026-06-16days on market $1,499,000 Active 13 DOM
-
2026-06-15days on market $1,499,000 Active 12 DOM
-
2026-06-13days on market $1,499,000 Active 10 DOM
-
2026-06-13days on market $1,499,000 Active 9 DOM
-
2026-06-09days on market $1,499,000 Active 6 DOM
-
2026-06-08days on market $1,499,000 Active 5 DOM
-
2026-06-07days on market $1,499,000 Active 4 DOM
-
2026-06-04remarks 602-char remark
-
2026-06-04$1,499,000 Active 1 DOM
ⓘ Source: listings_history table (triggers on properties + properties_extension) + one-shot
backfill from property_details.listing_events for pre-trigger history.
Nearby sold comps map
Loading sold comps map…
Walkable amenities ~0.75 mi
Loading nearby amenities…
Taxation est. · year 1
- Rental income
- $189,964
- − Mortgage interest
- −$72,540
- − Property taxes
- −$19,425
- − Insurance
- −$6,475
- − Repairs & maintenance
- −$15,197
- − Management
- −$15,197
- − Depreciation
- −$37,673
- Taxable income
- $23,457
- Est. tax owed @ 24.0%
- −$5,630
- After-tax cash flow
- $37,048/yr
For passive investors: Depreciation is non-cash, so a rental often shows a tax loss while cash-flowing — sheltering income. Rental losses are passive: they offset passive income freely, and up to $25,000/yr can offset ordinary (W-2) income if you actively participate and your MAGI is under $100k (phasing out to $0 by $150k); unused losses carry forward. On sale, claimed depreciation is recaptured at up to 25%, and gains may owe capital-gains tax (a 1031 exchange can defer both). Figures are a year-1 estimate at your 24.0% rate — not tax advice; consult a CPA.
Schools (NCES district)
- District
- East Hampton Union Free School District
- NCES district ID
- 3609660
- Math proficiency
- 62% ▼ -5.00%
- Reading proficiency
- 66% ▲ 2.00%
- Median HH income
- $86,309
- Composite
- 57.85/100
- National rank
- #1046
- State rank
- #159 of 590 in NY
Livability — East Hampton North
- Score
- 59/100
- State rank
- #1013
- US rank
- #19706
Category grades
Schools grade is shown separately in the Schools card above.
Census & demographics
- Census place
- East Hampton North, NY
- County
- Suffolk County · 679,920 people
- Metro
- New York-Newark-Jersey City, NY-NJ-PA
- Population (ZIP)
- 21,882
- Household income
- $129,883
- Rent vs Own
- Severe rent burden
- 896.0
Population outlook (Suffolk County) Hauer SSP2
- Today (2025)
- 1,505,262 people
- By 2030
- 1,498,318 · -0.5%
- By 2040
- 1,471,101 · -2.3%
- By 2050
- 1,424,848 · -5.3%
- By 2075
- 1,337,157 · -11.2%
- By 2100
- 1,217,720 · -19.1%
Race, ethnicity, and origin ACS 2023
- Neighborhood character
- Majority White (61%)
- Race & ethnicity
- White 61% Hispanic / Latino 32% Two or more races 23% Black 2% Asian 2%
- Hispanic origin (detail)
- Mexican 2% Puerto Rican 1%
- Common ancestry
- Romanian 5% Scotch-Irish 4% Italian 2%
- Foreign-born
- 25% · Canada, Guatemala, Jamaica
- Languages at home
- 68% English-only · Spanish 28% Other Indo-European 1% Russian/Polish/Slavic 1%
Political lean MEDSL · Suffolk
- 2024 margin
- Lean R (+10.0) · D 45.0% · R 55.0%
- 2008→2024 swing
- -16.0pp toward R · 2008: 6.0pp · 2024: -10.0pp
- All cycles
- 2024: R+10.0 2020: R+0.0 2016: R+8.2 2012: D+2.9 2008: D+6.0
Not yet ingested
- Civics
- —
Market trends
- HPI YoY
- ▼ -285.21%
- Current HPI
- 444.1499
- Rent YoY
- ▲ 12.28%
- Metro
- New York-Newark-Jersey City, NY-NJ-PA
- State GDP YoY
- ▲ 2.60%
- F500 in state
- 92
Industry mix (Fortune 500 HQ in NY)
| Industry | F500 HQs | Revenue |
|---|---|---|
| Financial Services | 10 | $950B |
|
||
| Consumer Goods | 9 | $162B |
|
||
| Insurance | 4 | $225B |
|
||
| Telecommunications | 2 | $144B |
|
||
| Pharmaceuticals | 2 | $112B |
|
||
| Media / Entertainment | 2 | $69B |
|
||
Price history
1 event — show timeline
- 2026-06-01 Listed $1,499,000 OneKey® MLS as Distributed by MLS Grid
Property tax history
-4.2%/yrLatest (2025): $234 · +0.0% YoY. Source: county tax records.
Cash-flow waterfall
monthlySold comps — $/sqft
last 12 mo · ≤1 miLoading sold comps…