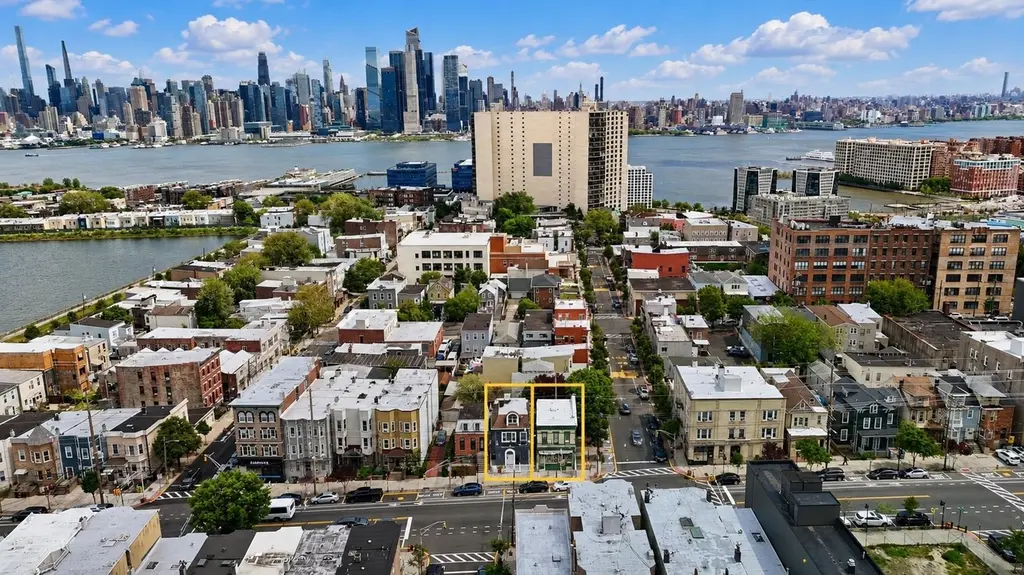
1800 PALISADE Ave
Union City, NJ 07087
$750,000A
8 bd · 10.0 ba ·
— sqft ·
Built —
· MultiFamily
· Under Contract
· 35 DOM
Cashflow @ list (25.0% down · 7.5%)
Estimated rent
$10,947/mo
Mortgage (P&I)
−$3,933
Tax + insurance
−$1,250
HOA
−$0
Vac / Maint / Mgmt
−$2,299
Net cashflow
$3,465/mo
Annual
$41,581/yr
Cap rate
11.84%
Cash-on-cash
19.80%
DSCR
1.88
1% rule
1.46%
Cash to close
$210,000
Investor read
- This is a 4 × 2-bed/?-bath units multifamily listed at $750k. Condition is rated good.
- At list price, monthly cash flow is $3k ($42k/yr) — positive. Per door: $866/mo.
- The deal already cash-flows at list — no discount required.
- Meets the 1% rule at list price ($11k rent vs $750k).
- It's been on market 35 days — a 3% lower offer ($728k) is reasonable based on typical stale-listing flexibility.
- Recommended offer: $728k (3.0% below list) — sets the bar for market timing.
- In year one you build about $80k of equity ($5k loan paydown + $75k appreciation (10.0% local appreciation)).
- Location reads 77/100 on livability (#117 in NJ, #2,998 nationally) — a middle-class / working-renter tenant base. Strengths: amenities A+, commute A+, health & safety A; Watch: cost of living F.
- Union City School District (suburban): math 15% / reading 36% proficiency, ranked #399 of 472 in NJ (top 84%) — low school quality limits family demand, transient renter base, plan for 1-2y turnover; 85% free/reduced lunch — lower-income household profile, screen leases tightly.
- Market conditions: Rents flat; 226 active listings in the ZIP; 5,310 units permitted in Hudson County in 2024 (4,154 in 5+ unit buildings).
- Hudson County population projected at +29% by 2050 — long-run rental-demand tailwind backs the buy-and-hold thesis.
- At projected returns (10.0% appreciation + 0.9% rent growth), your $210k cash investment doubles in ~2 years — after that, you're playing with house money.
- By year 2, paydown + projected appreciation supports a ~$129k cash-out refi (75% LTV) — recoverable capital for the next deal without selling this one.
- Cap rate 11.8% vs local median 2.3% in Union City — top-decile yield for the area; either an underpriced asset or a hidden risk that comps aren't pricing in. Stress-test before assuming the spread holds.
- At $10,947/mo this rent would consume 204% of the median local household income ($64k/yr) (locally 6042% of renters already pay >50% of income on rent) — very limited rent-growth headroom before tenants either downsize or default.
Questions for listing agent
- It's been on market 35 days. Have you received any prior offers? Is the seller open to a 3% concession, seller financing, or rate buy-down credit?
- Can we see the unit-by-unit rent roll, current vacancy, and any below-market leases? What's the average tenancy length?
- What capital expenditures (roof, boiler, parking lot, exteriors) have been made in the last 5 years, and what's planned in the next 2?
- Is there a deadline driving the sale (1031 exchange, divorce, estate, relocation)? That informs how much negotiation room exists.
- What's the average days-on-market for RENTAL listings here right now (not sales)? A rising rental-DOM trend means longer vacancies and softer asking-rent achievability than the comps imply.
- What's the recent tenant-quality profile in this submarket — average credit score on applications, eviction rate, late-payment / NSF rate, and stable-employment percentage? A property-management company in the area should have these aggregated.
- How much new apartment / multifamily construction is in the pipeline within 1–3 miles? Heavy new supply (>2% of stock underway) typically softens rents 12–24 months out; light construction supports rent growth.
CashFlowRE · CFR-6RHN14BBF0911Q
· Data 5 days ago
cashflowre.app · 2026-05-29