 Fourplex
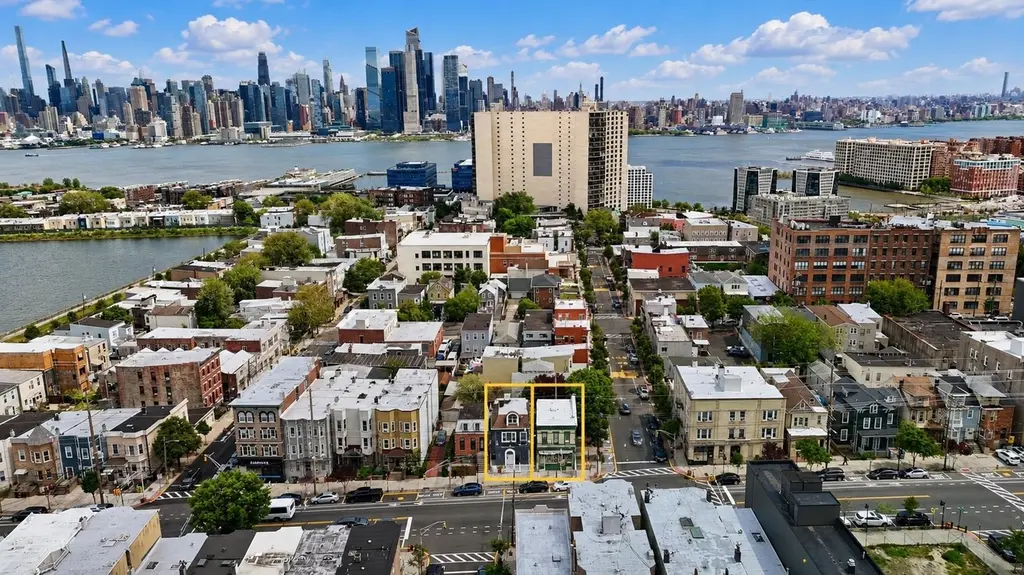
1800 PALISADE Ave · Union City, NJ
Flood risk No data
- FEMA flood zone
- —
- Chance of flooding over 30 yrs
- —
- Est. flood insurance / yr
- —
Fire risk No data
- Est. fire insurance / yr
- —
Heat risk No data
- Hot days now (above threshold)
- —
- Hot days in 30 yrs
- —
Wind risk No data
- Chance of severe wind over 30 yrs
- —
Air-quality risk No data
- Unhealthy air days now
- —
- Unhealthy air days in 30 yrs
- —
Risk factors via First Street. Map © Google.
Why this score? — see what drove the A grade
The composite is a weighted blend of 9 inputs, each scored 0–100. Each bar is that input's sub-score; the figure is the points it added to the 100-point composite (weight × sub-score).
- Cash flow +30.0/30.0
- ARV discount +15.0/15.0
- DSCR +10.0/10.0
- Appreciation +10.0/10.0
- 1% rule +9.6/10.0
- Condition / age +4.0/5.0
- Livability +3.9/5.0
- Rent growth +2.7/5.0
- Schools +2.2/10.0
$750,000
🖨 Deal sheet (PDF) 📄 Offer letter ✓ Due diligence
Multi-family units
County records classify this as Multi-Family (2-4 Unit). Listing-text estimate: 4 units. confirmed
Listing remarks
Excellent investment opportunity to acquire four units in a prime Union City location, formerly known as West Hoboken. Each property features two units, including one with a commercial space ideal for retail, restaurant, or shop use. Perfectly positioned on the corner of Palisade Avenue and 18th Street, this property offers outstanding visibility and convenience. Whether you are looking to owner-occupy or generate strong rental income with future upside, these properties check all the boxes. Even better, there is NO RENT CONTROL, and three of the four units will be delivered vacant, offering immediate flexibility and value-add potential. The location is unbeatable for commuters, with NYC bu
Key facts
- Commercial space
- Nyc bus stops
- Listed 35 days
Tags
Property features AI
Exterior
- Parking: No parking
- Construction: Lead paint form: Yes
- Exterior features: Brick exterior; Unfinished basement
Interior
- Kitchen: One kitchen (located on level 2)
- Bedrooms: Two bedrooms on the second floor
- Bathrooms: Three total bathrooms (two full, one half); One full bathroom on the first floor; One full bathroom on the second floor; One half bathroom in the basement
- Interior features: Window A/C; Baseboard heating
Neighborhood map
What this means for you Summary
Snapshot
- This is a 4 × 2-bed/?-bath units multifamily listed at $750k. Condition is rated good.
Deal economics
- At list price, monthly cash flow is $3k ($42k/yr) — positive. Per door: $866/mo.
- The deal already cash-flows at list — no discount required.
- Meets the 1% rule at list price ($11k rent vs $750k).
- Recommended offer: $728k (3.0% below list) — sets the bar for market timing.
- Cap rate 11.8% vs local median 2.3% in Union City — top-decile yield for the area; either an underpriced asset or a hidden risk that comps aren't pricing in. Stress-test before assuming the spread holds.
Location & tenants
- Location reads 77/100 on livability (#117 in NJ, #2,998 nationally) — a middle-class / working-renter tenant base. Strengths: amenities A+, commute A+, health & safety A; Watch: cost of living F.
- Union City School District (suburban): math 15% / reading 36% proficiency, ranked #399 of 472 in NJ (top 84%) — low school quality limits family demand, transient renter base, plan for 1-2y turnover; 85% free/reduced lunch — lower-income household profile, screen leases tightly.
- Market conditions: Rents flat; 226 active listings in the ZIP; 5,310 units permitted in Hudson County in 2024 (4,154 in 5+ unit buildings).
- At $10,947/mo this rent would consume 204% of the median local household income ($64k/yr) (locally 6042% of renters already pay >50% of income on rent) — very limited rent-growth headroom before tenants either downsize or default.
Forward outlook
- In year one you build about $80k of equity ($5k loan paydown + $75k appreciation (10.0% local appreciation)).
- Hudson County population projected at +29% by 2050 — long-run rental-demand tailwind backs the buy-and-hold thesis.
- At projected returns (10.0% appreciation + 0.9% rent growth), your $210k cash investment doubles in ~2 years — after that, you're playing with house money.
- By year 2, paydown + projected appreciation supports a ~$129k cash-out refi (75% LTV) — recoverable capital for the next deal without selling this one.
Negotiation context
- It's been on market 35 days — a 3% lower offer ($728k) is reasonable based on typical stale-listing flexibility.
Questions for the listing agent
- It's been on market 35 days. Have you received any prior offers? Is the seller open to a 3% concession, seller financing, or rate buy-down credit?
- Can we see the unit-by-unit rent roll, current vacancy, and any below-market leases? What's the average tenancy length?
- What capital expenditures (roof, boiler, parking lot, exteriors) have been made in the last 5 years, and what's planned in the next 2?
- Is there a deadline driving the sale (1031 exchange, divorce, estate, relocation)? That informs how much negotiation room exists.
- What's the average days-on-market for RENTAL listings here right now (not sales)? A rising rental-DOM trend means longer vacancies and softer asking-rent achievability than the comps imply.
- What's the recent tenant-quality profile in this submarket — average credit score on applications, eviction rate, late-payment / NSF rate, and stable-employment percentage? A property-management company in the area should have these aggregated.
- How much new apartment / multifamily construction is in the pipeline within 1–3 miles? Heavy new supply (>2% of stock underway) typically softens rents 12–24 months out; light construction supports rent growth.
Investment metrics
- 1% rule
- 1.46% ✓
- Cap rate
- 11.84%
- Cash-on-cash
- 19.80%
- DSCR
- 1.88
- GRM
- 5.7
CMA / ARV
- ARV (median comp)
- $1,089,719
- List price
- $750,000
- Delta
- -31.17%
- Verdict
- UNDERPRICED
- Comps
- 12 within 1.0 mi
Show comp detail 12 sales within ~0.75 mi
| Address | Dist | Beds/Ba | Sqft | Sold | Price | $/sf | Match |
|---|---|---|---|---|---|---|---|
| 313 18TH St | 0.05mi | 8/3.0 | — | 5mo | $999,000 | — | 61 |
| 315 22ND St | 0.22mi | 8/4.0 | — | 1mo | $1,150,000 | — | 56 |
| 1400 MANHATTAN Ave | 0.19mi | 7/4.5 (-1) | — | 5mo | $1,100,000 | — | 55 |
| 2105 NEW YORK Ave | 0.22mi | 9/4.0 (+1) | — | 5mo | $942,500 | — | 53 |
| 2214 PALISADE Ave | 0.27mi | 7/4.5 (-1) | — | 3mo | $1,995,000 | — | 52 |
| 515 21ST St | 0.26mi | 7/3.0 (-1) | — | 4mo | $763,633 | — | 52 |
| 2211 NEW YORK Ave | 0.28mi | 9/4.0 (+1) | — | 4mo | $960,000 | — | 51 |
| 615 11TH St | 0.46mi | 9/3.5 (+1) | — | 6mo | $995,000 | — | 41 |
| 711A 27TH St | 0.56mi | 7/2.0 (-1) | — | 2mo | $775,000 | — | 40 |
| 317 7TH St | 0.54mi | 7/4.0 (-1) | — | 7mo | $637,500 | — | 37 |
| 525 28TH St | 0.55mi | 7/4.0 (-1) | — | 6mo | $650,000 | — | 36 |
| 1307 13TH St | 0.64mi | 7/2.0 (-1) | — | 4mo | $659,000 | — | 35 |
Match score weights: distance 35% · size 25% · config 20% · recency 20%. Top-matched comps best support the ARV.
Projected returns pro-forma
10.0% appreciation · 0.89% rent growth · sell at horizon
- IRR
- 37.9%
- Equity multiple
- 3.89×
- Total profit
- $606,563
- Equity at exit
- $675,659
- IRR
- 31.9%
- Equity multiple
- 8.48×
- Total profit
- $1,570,687
- Equity at exit
- $1,457,085
Cash invested: $210,000 (down + closing). Projections, not guarantees.
Landlord ↔ Tenant lean methodology
- Overall (STATE)
- 21 Tenant-Leaning
- State New Jersey
- 21 Tenant-Leaning · D+6
- County
- — inherits STATE
- City
- — inherits STATE
ZIP-level market 07087
- Home prices YoY
- 9.6%
- Rents YoY
- 0.9%
- Active inventory
- 226
- Price-to-rent
- 22.8×
Monthly cashflow live
- Estimated rent
- $10,947 high interval (Pro) →
- Mortgage (P&I)
- −$3,933
- Tax est. 1.5%
- −$938 /mo · $11,250/yr
- Insurance
- −$312
- HOA
- −$0
- Vacancy / Maint / Mgmt
- −$2,299
- Net cashflow
- $3,465
Break-even live
Sensitivity live
| Price | -10% $3,983 | -5% $3,724 | +0% $3,465 | +5% $3,206 | +10% $2,947 |
|---|---|---|---|---|---|
| Rent | -10% $2,600 | -5% $3,033 | +0% $3,465 | +5% $3,897 | +10% $4,330 |
| Rate | -1.0pp $3,843 | -0.5pp $3,656 | base $3,465 | +0.5pp $3,271 | +1.0pp $3,073 |
4-unit breakdown (identical units grouped — click to expand)
| Units | Beds | Baths | Est. rent |
|---|---|---|---|
| 4× units | 2 | — | $10,948 |
| #1 | 2 | — | $2,737 |
| #2 | 2 | — | $2,737 |
| #3 | 2 | — | $2,737 |
| #4 | 2 | — | $2,737 |
| Total (4 units) | $10,947 | ||
UW: 25.0% down · 7.5% · 30yr · 1.5% tax · 5.0% vac · 8.0% maint · 8.0% mgmt
Financing live
Cash to close
- Down payment
- $187,500
- Closing costs
- $22,500
- Reserves months
- —
- Total cash needed
- —
Loan-product check · same deal, 3 products live
Conventional
25% down · 7.5% · 30yr
- Down + closing
- —
- Monthly P&I
- —
- Monthly cashflow
- —
- DSCR
- —
- Eligible?
- —
Personal DTI + credit; lowest rate.
DSCR
20% down · 8.5% · 30yr
- Down + closing
- —
- Monthly P&I
- —
- Monthly cashflow
- —
- DSCR
- —
- Eligible?
- —
No personal income docs; deal must DSCR.
Hard money
10% down · 12.0% · 12mo
- Down + closing
- —
- Monthly P&I
- —
- Monthly cashflow
- —
- DSCR
- —
- Eligible?
- —
Short-term bridge; refi at stabilization.
Listing history 13 events
-
2026-06-15status $750,000 Under Contract 35 DOM
-
2026-06-15days on market $750,000 Active 35 DOM
-
2026-06-13days on market $750,000 Active 33 DOM
-
2026-06-13days on market $750,000 Active 32 DOM
-
2026-06-09days on market $750,000 Active 29 DOM
-
2026-06-08days on market $750,000 Active 28 DOM
-
2026-06-07days on market $750,000 Active 27 DOM
-
2026-06-04days on market $750,000 Active 24 DOM
-
2026-06-03days on market $750,000 Active 23 DOM
-
2026-06-02days on market $750,000 Active 22 DOM
-
2026-06-01days on market $750,000 Active 21 DOM
-
2026-05-31days on market $750,000 Active 20 DOM
-
2026-05-11$750,000 Active 1098-char remark
ⓘ Source: listings_history table (triggers on properties + properties_extension) + one-shot
backfill from property_details.listing_events for pre-trigger history.
Nearby sold comps map
Loading sold comps map…
Walkable amenities ~0.75 mi
Loading nearby amenities…
Taxation est. · year 1
- Rental income
- $131,364
- − Mortgage interest
- −$42,012
- − Property taxes
- −$11,250
- − Insurance
- −$3,750
- − Repairs & maintenance
- −$10,509
- − Management
- −$10,509
- − Depreciation
- −$21,818
- Taxable income
- $31,516
- Est. tax owed @ 24.0%
- −$7,564
- After-tax cash flow
- $34,017/yr
For passive investors: Depreciation is non-cash, so a rental often shows a tax loss while cash-flowing — sheltering income. Rental losses are passive: they offset passive income freely, and up to $25,000/yr can offset ordinary (W-2) income if you actively participate and your MAGI is under $100k (phasing out to $0 by $150k); unused losses carry forward. On sale, claimed depreciation is recaptured at up to 25%, and gains may owe capital-gains tax (a 1031 exchange can defer both). Figures are a year-1 estimate at your 24.0% rate — not tax advice; consult a CPA.
Condition & rehab AI · 12 photos
This four-unit property in Union City, NJ, offers excellent investment potential with a prime location and no rent control. The units are in good condition with modern kitchens and bathrooms, and the exterior is well-maintained. While the property is move-in ready, updates to the kitchens and bathrooms can further enhance its value.
Value-add opportunities
- Both update kitchen appliances — modernizing kitchen can attract both buyers and renters
- Both renovate bathrooms — modernizing bathrooms can attract both buyers and renters
- Both landscape front yard — improved curb appeal can attract buyers and renters
Renovation cost estimate screening
Value-add ROI direction
- Both update kitchen appliances — modernizing kitchen can attract both buyers and renters ↑
- Both renovate bathrooms — modernizing bathrooms can attract both buyers and renters ↑
- Both landscape front yard — improved curb appeal can attract buyers and renters ↑
ⓘ Cost ranges are severity-bucket heuristics (US national rule-of-thumb). Get contractor quotes + a written scope before underwriting a rehab budget.
Schools (NCES district)
- District
- Union City School District
- NCES district ID
- 3416380
- Math proficiency
- 15% ▼ -19.00%
- Reading proficiency
- 36% ▼ -19.00%
- Median HH income
- $41,210
- Composite
- 21.55/100
- National rank
- #8312
- State rank
- #399 of 472 in NJ
Livability — Union City
- Score
- 77/100
- State rank
- #117
- US rank
- #2998
Category grades
Schools grade is shown separately in the Schools card above.
Census & demographics
- Census place
- Union City, NJ
- County
- Hudson County · 718,323 people
- City population
- 66,463
- Metro
- New York-Newark-Jersey City, NY-NJ-PA
- Population (ZIP)
- 66,463
- Household income
- $64,310
- Rent vs Own
- Severe rent burden
- 6042.0
Population outlook (Hudson County) Hauer SSP2
- Today (2025)
- 771,834 people
- By 2030
- 818,028 · +6.0%
- By 2040
- 907,866 · +17.6%
- By 2050
- 994,480 · +28.8%
- By 2075
- 1,163,301 · +50.7%
- By 2100
- 1,254,703 · +62.6%
Race, ethnicity, and origin ACS 2023
- Neighborhood character
- Predominantly Hispanic (82%)
- Race & ethnicity
- Hispanic / Latino 82% Two or more races 28% White 10% Asian 4% Black 3% Native American 2%
- Hispanic origin (detail)
- Mexican 7% Puerto Rican 8% Cuban 9% Dominican 17%
- Foreign-born
- 55% · Canada, Jamaica, China
- Languages at home
- 18% English-only · Spanish 74% Other Indo-European 2% Arabic 1%
Political lean MEDSL · Hudson
- 2024 margin
- Strong D (+28.1) · D 62.6% · R 34.6% · Other 2.8%
- 2008→2024 swing
- -18.7pp toward R · 2008: 46.7pp · 2024: 28.1pp
- All cycles
- 2024: D+28.1 2020: D+46.2 2016: D+51.8 2012: D+55.7 2008: D+46.7
Not yet ingested
- Civics
- —
Market trends
- HPI YoY
- ▲ 52.10%
- Current HPI
- 597.8126
- Rent YoY
- ▲ 0.89%
- Metro
- New York-Newark-Jersey City, NY-NJ-PA
- State GDP YoY
- ▲ 2.05%
- F500 in state
- 34
Industry mix (Fortune 500 HQ in NJ)
| Industry | F500 HQs | Revenue |
|---|---|---|
| Consumer Goods | 3 | $31B |
|
||
| Pharmaceuticals | 2 | $153B |
|
||
| Technology | 2 | $21B |
|
||
| Insurance | 2 | $20B |
|
||
| Healthcare | 2 | $19B |
|
||
| Financial Services | 1 | $70B |
|
||
Price history
2 events — show timeline
- 2026-06-15 Pending — HCMLS
- 2026-05-11 Listed $750,000 HCMLS
Cash-flow waterfall
monthlySold comps — $/sqft
last 12 mo · ≤1 miLoading sold comps…