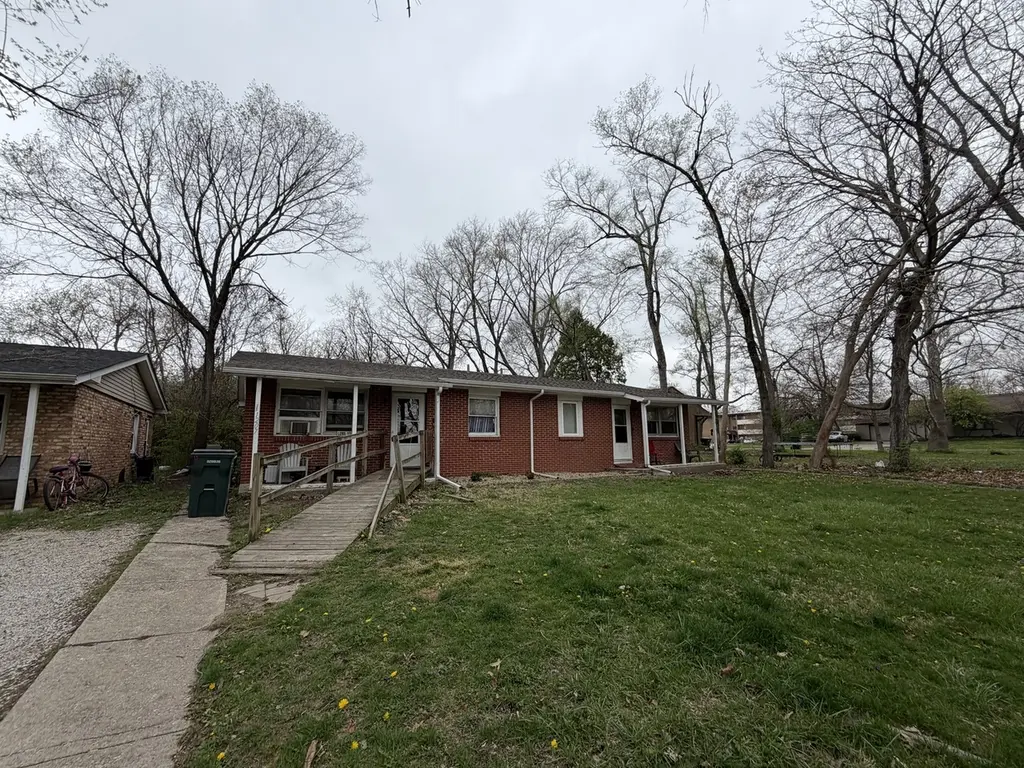
1207 Linview Ave
Urbana, IL 61801
$149,900F
None bd · None ba ·
— sqft ·
Built 1963
· Other
· Pending
· 15 DOM
Cashflow @ list (25.0% down · 7.5%)
Estimated rent
$1,328/mo
Mortgage (P&I)
−$786
Tax + insurance
−$386
HOA
−$0
Vac / Maint / Mgmt
−$279
Net cashflow
$-123/mo
Annual
$-1,477/yr
Cap rate
5.31%
Cash-on-cash
-3.52%
DSCR
0.84
1% rule
0.89%
Cash to close
$41,972
Investor read
- This is a other listed at $150k.
- At list price, monthly cash flow is $-123 ($-1k/yr) — negative.
- To cash-flow at today's rent, offer at most $128k (14.5% below list).
- To meet the 1% rule (rent ≥ 1% of price), the offer needs to be $133k (11.4% below list).
- It's been on market 15 days — a 2% lower offer ($148k) is reasonable based on typical stale-listing flexibility.
- Recommended offer: $128k (14.5% below list) — sets the bar for cash-flow.
- Local home prices are declining (-3.0%/yr); year-one equity from $1k of loan paydown is wiped out by about $4k of value loss. Plan a longer hold.
- Location reads 80/100 on livability (#110 in IL, #1,793 nationally) — a professional / high-income tenant draw. Strengths: amenities A+, commute A+, cost of living A+; Watch: employment D, schools D-, crime F.
- Urbana SD 116 (urban): math 11% / reading 13% proficiency, ranked #568 of 620 in IL (top 92%) — low school quality limits family demand, transient renter base, plan for 1-2y turnover; 64% free/reduced lunch — lower-income household profile, screen leases tightly.
- Watch-outs: property tax is 2.6% of price.
- Market conditions: Rents rising fast (+4.4%/yr); 63 active listings in the ZIP; 34 comparable units currently listed for rent nearby; rentals lingering (median 45d on market — plan ~5-8 weeks vacancy on turnover, expect pricing pressure); 59% of comp listings sitting > 30 days — soft ceiling on asking rent; lower-income renter base — watch delinquency; 573 units permitted in Champaign County in 2024 (359 in 5+ unit buildings).
- Champaign County population projected at +15% by 2050 — modest demand growth; plan on rents tracking national, not racing it.
- 6 sale attempts since 28y ago with the ask held roughly flat each time — persistent listings suggest the price (not the market) is what's stuck; bring a comps-based counter.
- Cap rate 5.3% vs local median 3.6% in Urbana — top-decile yield for the area; either an underpriced asset or a hidden risk that comps aren't pricing in. Stress-test before assuming the spread holds.
- This rent runs 44% of the median local income ($36k/yr) — at the standard rent-burdened threshold; future hikes will face affordability resistance.
Questions for listing agent
- What do current leases actually rent for vs. the listed asking? Can we see a recent rent roll and the last 12 months of T-12 income?
- Built in 1963 — when were the roof, HVAC, electrical panel, plumbing, and water heater last replaced?
- Property tax is high relative to price — has the assessment been appealed recently, and will the sale trigger a re-assessment?
- Is there a deadline driving the sale (1031 exchange, divorce, estate, relocation)? That informs how much negotiation room exists.
- Schools are D-rated, which usually means shorter tenancies and higher turnover. Who's the typical renter profile here, and what's been the actual vacancy rate?
- Crime grade is F in this area — have there been break-ins, vandalism, or insurance claims at this property in the last 3 years? What carrier currently insures it and at what premium?
- The area grade is low — what's the realistic commute time and amenity access for the typical tenant pool here? Any planned neighborhood developments (good or bad) we should know about?
- What's the average days-on-market for RENTAL listings here right now (not sales)? A rising rental-DOM trend means longer vacancies and softer asking-rent achievability than the comps imply.
CashFlowRE · CFR-6SWKARARP2HE7E
· Data 4 days ago
cashflowre.app · 2026-05-29