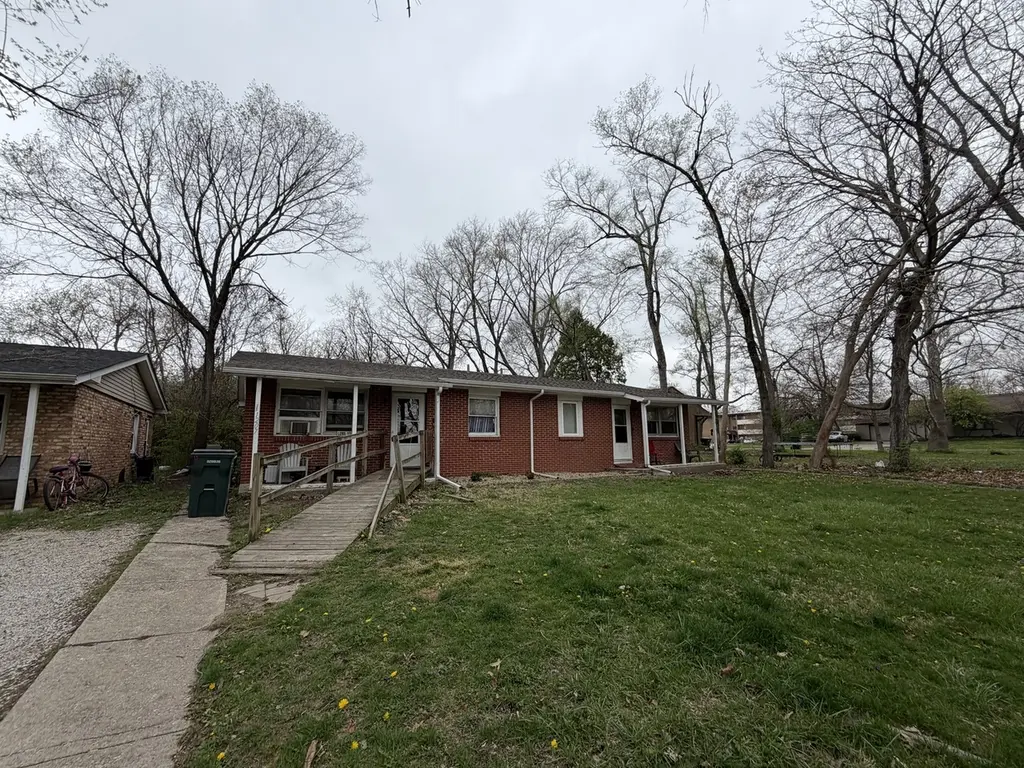
1207 Linview Ave · Urbana, IL
Flood risk 1/10 · Minimal
- FEMA flood zone
- X (unshaded)
- Chance of flooding over 30 yrs
- 0.0%
- Est. flood insurance / yr
- $507 – $1,088
Fire risk 1/10 · Minimal
- Est. fire insurance / yr
- $804 – $1,492
Heat risk 3/10 · Minor
- Hot days now (above 104°F)
- 7 days/yr
- Hot days in 30 yrs
- 18 days/yr
Wind risk 2/10 · Minimal
- Chance of severe wind over 30 yrs
- 1.0%
Air-quality risk 2/10 · Minimal
- Unhealthy air days now
- 1 days/yr
- Unhealthy air days in 30 yrs
- 2 days/yr
Risk factors via First Street. Map © Google.
Why this score? — see what drove the F grade
The composite is a weighted blend of 9 inputs, each scored 0–100. Each bar is that input's sub-score; the figure is the points it added to the 100-point composite (weight × sub-score).
- Cash flow +8.8/30.0
- ARV discount +7.5/15.0
- Livability +4.0/5.0
- 1% rule +3.9/10.0
- Rent growth +3.6/5.0
- Condition / age +2.5/5.0
- DSCR +2.4/10.0
- Schools +1.0/10.0
- Appreciation +0.0/10.0
$149,900
🖨 Deal sheet 📄 Offer letter ✓ Due diligence
Listing remarks MLS
This well-located Urbana duplex offers an excellent opportunity for both new investors and seasoned portfolio builders! Each unit features 2 bedrooms and 1 full bath, providing comfortable and functional living spaces for tenants. One side has been fully remodeled, showcasing modern updates throughout, including all new appliances, a new hot water heater, and an efficient mini-split A/C system. Ideally situated near the U of I campus, as well as popular shopping and dining options, this property offers strong rental potential in a high-demand area. Whether you're looking to live in one unit and rent the other or add a solid income-producing property to your portfolio, this duplex is full of potential.
Key facts
- Fully remodeled
- Modern updates
- New hot water heater
Tags
Property features AI
Finance
- Other: Subdivision: Linview 3rd Sub; Directions: From Lincoln Ave, east on Sunset Dr, right on Linview Ave
- Financial info: Annual tax amount: $3,166
Exterior
- Utilities: Public water; Public sewer
- Home design: Duplex residential income property; One story
- Exterior features: Shingle roof; Lot approximately 0.22 acres; Residential zoning
Interior
- Heating & cooling: Ductless cooling
- Interior features: Gas water heater; Ductless cooling
Neighborhood map
What this means for you Summary
Snapshot
- This is a other listed at $150k.
Deal economics
- At list price, monthly cash flow is $-123 ($-1k/yr) — negative.
- To cash-flow at today's rent, offer at most $128k (14.5% below list).
- To meet the 1% rule (rent ≥ 1% of price), the offer needs to be $133k (11.4% below list).
- Recommended offer: $128k (14.5% below list) — sets the bar for cash-flow.
- Cap rate 5.3% vs local median 3.6% in Urbana — top-decile yield for the area; either an underpriced asset or a hidden risk that comps aren't pricing in. Stress-test before assuming the spread holds.
Location & tenants
- Location reads 80/100 on livability (#110 in IL, #1,793 nationally) — a professional / high-income tenant draw. Strengths: amenities A+, commute A+, cost of living A+; Watch: employment D, schools D-, crime F.
- Urbana SD 116 (urban): math 11% / reading 13% proficiency, ranked #568 of 620 in IL (top 92%) — low school quality limits family demand, transient renter base, plan for 1-2y turnover; 64% free/reduced lunch — lower-income household profile, screen leases tightly.
- Market conditions: Rents rising fast (+4.4%/yr); 63 active listings in the ZIP; 34 comparable units currently listed for rent nearby; rentals lingering (median 44d on market — plan ~5-8 weeks vacancy on turnover, expect pricing pressure); 59% of comp listings sitting > 30 days — soft ceiling on asking rent; lower-income renter base — watch delinquency; 573 units permitted in Champaign County in 2024 (359 in 5+ unit buildings).
- This rent runs 44% of the median local income ($36k/yr) — at the standard rent-burdened threshold; future hikes will face affordability resistance.
Forward outlook
- Local home prices are declining (-3.0%/yr); year-one equity from $1k of loan paydown is wiped out by about $4k of value loss. Plan a longer hold.
- Champaign County population projected at +15% by 2050 — modest demand growth; plan on rents tracking national, not racing it.
Negotiation context
- It's been on market 15 days — a 2% lower offer ($148k) is reasonable based on typical stale-listing flexibility.
- 6 sale attempts since 28y ago with the ask held roughly flat each time — persistent listings suggest the price (not the market) is what's stuck; bring a comps-based counter.
Risks & watch-outs
- Watch-outs: property tax is 2.6% of price.
Questions for the listing agent
- What do current leases actually rent for vs. the listed asking? Can we see a recent rent roll and the last 12 months of T-12 income?
- Built in 1963 — when were the roof, HVAC, electrical panel, plumbing, and water heater last replaced?
- Property tax is high relative to price — has the assessment been appealed recently, and will the sale trigger a re-assessment?
- Is there a deadline driving the sale (1031 exchange, divorce, estate, relocation)? That informs how much negotiation room exists.
- Schools are D-rated, which usually means shorter tenancies and higher turnover. Who's the typical renter profile here, and what's been the actual vacancy rate?
- Crime grade is F in this area — have there been break-ins, vandalism, or insurance claims at this property in the last 3 years? What carrier currently insures it and at what premium?
- The area grade is low — what's the realistic commute time and amenity access for the typical tenant pool here? Any planned neighborhood developments (good or bad) we should know about?
- What's the average days-on-market for RENTAL listings here right now (not sales)? A rising rental-DOM trend means longer vacancies and softer asking-rent achievability than the comps imply.
- What's the recent tenant-quality profile in this submarket — average credit score on applications, eviction rate, late-payment / NSF rate, and stable-employment percentage? A property-management company in the area should have these aggregated.
- How much new for-sale + rental construction is in the pipeline within 1–3 miles? Heavy new supply typically softens prices + rents 12–24 months out; constrained supply supports both.
Investment metrics
- 1% rule
- 0.89% ✗
- Cap rate
- 5.31%
- Cash-on-cash
- -3.52%
- DSCR
- 0.84
- GRM
- 9.4
CMA / ARV
- ARV (median comp)
- $712,506
- List price
- $149,900
- Delta
- -78.96%
- Verdict
- UNDERPRICED
- Comps
- 3 within 1.0 mi
Projected returns pro-forma
-3.0% appreciation · 4.4% rent growth · sell at horizon
- IRR
- -20.3%
- Equity multiple
- 0.28×
- Total profit
- $-30,129
- Equity at exit
- $22,351
- IRR
- -10.2%
- Equity multiple
- 0.34×
- Total profit
- $-27,899
- Equity at exit
- $12,961
Cash invested: $41,972 (down + closing). Projections, not guarantees.
Landlord ↔ Tenant lean methodology
- Overall (STATE)
- 43 Moderately Tenant-Leaning
- State Illinois
- 43 Moderately Tenant-Leaning · D+7
- County
- — inherits STATE
- City
- — inherits STATE
ZIP-level market 61801
- Home prices YoY
- -27.4%
- Rents YoY
- 4.4%
- Active inventory
- 63
- Price-to-rent
- 9.4×
Monthly cashflow live
- Estimated rent
- $1,328 high interval (Pro) →
- Mortgage (P&I)
- −$786
- Tax from tax record
- −$324 /mo · $3,885/yr
- Insurance
- −$62
- HOA
- −$0
- Vacancy / Maint / Mgmt
- −$279
- Net cashflow
- $-123
Break-even live
UW: 25.0% down · 7.5% · 30yr · 1.5% tax · 5.0% vac · 8.0% maint · 8.0% mgmt
Financing live
Cash to close
- Down payment
- $37,475
- Closing costs
- $4,497
- Reserves months
- —
- Total cash needed
- —
Loan-product check · same deal, 3 products live
Conventional
25% down · 7.5% · 30yr
- Down + closing
- —
- Monthly P&I
- —
- Monthly cashflow
- —
- DSCR
- —
- Eligible?
- —
Personal DTI + credit; lowest rate.
DSCR
20% down · 8.5% · 30yr
- Down + closing
- —
- Monthly P&I
- —
- Monthly cashflow
- —
- DSCR
- —
- Eligible?
- —
No personal income docs; deal must DSCR.
Hard money
10% down · 12.0% · 12mo
- Down + closing
- —
- Monthly P&I
- —
- Monthly cashflow
- —
- DSCR
- —
- Eligible?
- —
Short-term bridge; refi at stabilization.
Rent comps 34 comps
| Address | Beds | Baths | Sqft | Rent | $/sqft | DOM | Units | Dist |
|---|---|---|---|---|---|---|---|---|
| 1202 N Lincoln Ave Urbana, IL | 3.0 | 1.0 | 1150 | $1,395 | $1.21 | 21d | 1 | 0.06mi |
| 808 N Lincoln Ave Unit 2 Urbana, IL | 2.0 | 1.0 | 800 | $995 | $1.24 | 43d | 1 | 0.23mi |
| 1113 W Hill St Urbana, IL | 2.0 | 1.0 | — | $1,050 | — | 21d | 1 | 0.39mi |
| 1901 N Lincoln Ave Urbana, IL | 2.0 | 2.0 | 821 | $660 | $0.80 | 43d | 1 | 0.46mi |
| 1305 Eureka St Urbana, IL | 3.0 | 1.0 | — | $1,450 | — | 43d | 1 | 0.48mi |
| 904 N Broadway Ave Urbana, IL | 2.0 | 1.0 | 825 | $972 | $1.18 | 21d | 1 | 0.60mi |
| 201 W Park St Urbana, IL | 2.0 | 1.0 | — | $850 | — | 43d | 1 | 0.61mi |
| 704 Stoughton St Urbana, IL | 1.0 | 1.0 | 550 | $1,035 | $1.88 | 43d | 1 | 0.66mi |
| 1009 Stoughton St Urbana, IL | 1.0 | 1.0 | — | $1,600 | — | 43d | 1 | 0.70mi |
| 510 E White St Champaign, IL | 1.0 | 1.0 | — | $1,620 | — | 43d | 1 | 0.89mi |
| 507 E White St Champaign, IL | 1.0 | 1.0 | 476 | $1,300 | $2.73 | 43d | 1 | 0.92mi |
| 712 W Illinois St #2 Urbana, IL | 2.0 | 1.0 | — | $1,095 | — | 43d | 1 | 0.94mi |
| 1601 N Willow Rd Unit 203 Urbana, IL | 2.0 | 1.0 | — | $1,050 | — | 43d | 1 | 0.95mi |
| 1601 N Willow Rd Urbana, IL | 2.0 | 1.0 | — | $1,100 | — | 21d | 1 | 0.95mi |
| 301 W Illinois St Apt 4 Urbana, IL | 1.0 | 1.0 | — | $865 | — | 43d | 1 | 1.05mi |
| 200 S Vine St Unit 128 Urbana, IL | 2.0 | 2.5 | 1292 | $1,795 | $1.39 | 21d | 1 | 1.07mi |
| 702 W Nevada St Urbana, IL | 2.0 | 1.0 | — | $1,300 | — | 43d | 1 | 1.13mi |
| 1032 E Kerr Ave Urbana, IL | 1.0–2.0 | 1.0–2.0 | 777 | $1,430 | $1.84 | 13d | 46 | 1.13mi |
| 807 E Park St Unit A Urbana, IL | 1.0 | 1.0 | 450 | $995 | $2.21 | 21d | 1 | 1.14mi |
| 506 E Elm St Unit 2 Urbana, IL | 1.0 | 1.0 | 760 | $1,500 | $1.97 | 43d | 1 | 1.14mi |
| 503 S Urbana Ave Urbana, IL | 2.0 | 1.5 | 775 | $1,275 | $1.65 | 13d | 2 | 1.22mi |
| 503 S Urbana Ave Apt C Urbana, IL | 2.0 | 1.5 | 775 | $1,250 | $1.61 | 43d | 1 | 1.22mi |
| 106 E Healey St Champaign, IL | 2.0 | 1.0 | 690 | $709 | $1.03 | 43d | 1 | 1.31mi |
| 520 N Neil St Champaign, IL | 1.0–2.0 | 1.0–2.0 | 835 | $1,750 | $2.10 | 13d | 2 | 1.35mi |
| 415 N Neil St Unit 2 Champaign, IL | 1.0 | 1.0 | — | $1,650 | — | 43d | 1 | 1.38mi |
| 17 E University Ave Champaign, IL | 2.0 | 1.0 | 417 | $1,410 | $3.38 | 43d | 2 | 1.38mi |
| 17 E University Ave Unit 17-308 Champaign, IL | 2.0 | 1.0 | 507 | $1,305 | $2.57 | 13d | 1 | 1.38mi |
| 301 N Neil St Champaign, IL | 3.0 | 2.5 | 3475 | $5,000 | $1.44 | 13d | 1 | 1.40mi |
| 1304 Christopher Cir Urbana, IL | 2.0 | 1.0 | 970 | $1,250 | $1.29 | 21d | 1 | 1.43mi |
| 1304 Christopher Cir Urbana, IL | 2.0 | 1.0 | 970 | $1,300 | $1.34 | 43d | 1 | 1.43mi |
| 502 E Washington St Urbana, IL | 3.0 | 2.0 | 1667 | $2,000 | $1.20 | 21d | 1 | 1.45mi |
| 217 S Neil St Champaign, IL | 1.0–2.0 | 1.0–2.0 | 816 | $1,795 | $2.20 | 13d | 4 | 1.49mi |
| 206 W Washington St Unit 4 Champaign, IL | 2.0 | 1.0 | 750 | $895 | $1.19 | 44d | 1 | 1.49mi |
| 48 E John St Champaign, IL | 3.0 | 3.0 | 330 | $739 | $2.24 | 43d | 1 | 1.50mi |
Listing history 25 events
-
2026-06-15remarks 699-char remark
-
2026-06-15days on market $149,900 Pending 15 DOM
-
2026-06-07statusdays on market $149,900 Pending 51 DOM
-
2026-06-03days on market $149,900 Active 49 DOM
-
2026-06-02days on market $149,900 Active 48 DOM
-
2026-06-01days on market $149,900 Active 47 DOM
-
2026-05-31days on market $149,900 Active 46 DOM
-
2026-05-30days on market $149,900 Active 45 DOM
-
2026-05-08price $149,900 710-char remark
Show marketing remark (710 chars)
This well-located Urbana duplex offers an excellent opportunity for both new investors and seasoned portfolio builders! Each unit features 2 bedrooms and 1 full bath, providing comfortable and functional living spaces for tenants. One side has been fully remodeled, showcasing modern updates throughout, including all new appliances, a new hot water heater, and an efficient mini-split A/C system. Ideally situated near the U of I campus, as well as popular shopping and dining options, this property offers strong rental potential in a high-demand area. Whether you're looking to live in one unit and rent the other or add a solid income-producing property to your portfolio, this duplex is full of potential.
-
2026-04-09historical 710-char remark
Show marketing remark (710 chars)
This well-located Urbana duplex offers an excellent opportunity for both new investors and seasoned portfolio builders! Each unit features 2 bedrooms and 1 full bath, providing comfortable and functional living spaces for tenants. One side has been fully remodeled, showcasing modern updates throughout, including all new appliances, a new hot water heater, and an efficient mini-split A/C system. Ideally situated near the U of I campus, as well as popular shopping and dining options, this property offers strong rental potential in a high-demand area. Whether you're looking to live in one unit and rent the other or add a solid income-producing property to your portfolio, this duplex is full of potential.
-
2025-02-10soldstatus $141,000 Closed 569-char remark
Show marketing remark (569 chars)
This Urbana duplex is the perfect chance to kickstart your investment journey, expand your portfolio, or enjoy the best of both worlds by living in one unit and renting out the other! Each side features 2 bedrooms and 1 bathroom. The north unit is move-in ready with fresh updates, including new flooring, modern paint, upgraded cabinets, and more. Giving potential for future income growth. Meanwhile, the south unit is occupied by a long-term tenant on a month-to-month lease, currently paying $650 per month. Don't miss out on this versatile opportunity! Sold As-Is
-
2025-01-09historical Contingent - No Showings 569-char remark
Show marketing remark (569 chars)
This Urbana duplex is the perfect chance to kickstart your investment journey, expand your portfolio, or enjoy the best of both worlds by living in one unit and renting out the other! Each side features 2 bedrooms and 1 bathroom. The north unit is move-in ready with fresh updates, including new flooring, modern paint, upgraded cabinets, and more. Giving potential for future income growth. Meanwhile, the south unit is occupied by a long-term tenant on a month-to-month lease, currently paying $650 per month. Don't miss out on this versatile opportunity! Sold As-Is
-
2024-12-19$150,000 Active 569-char remark
Show marketing remark (569 chars)
This Urbana duplex is the perfect chance to kickstart your investment journey, expand your portfolio, or enjoy the best of both worlds by living in one unit and renting out the other! Each side features 2 bedrooms and 1 bathroom. The north unit is move-in ready with fresh updates, including new flooring, modern paint, upgraded cabinets, and more. Giving potential for future income growth. Meanwhile, the south unit is occupied by a long-term tenant on a month-to-month lease, currently paying $650 per month. Don't miss out on this versatile opportunity! Sold As-Is
-
2013-10-03soldstatus $64,000
-
2013-09-30soldstatus $63,850
-
2013-09-18historical
-
2013-06-05$69,900
-
2012-09-04historical
-
2012-06-14
-
2012-06-01historical
-
2011-09-02
-
2011-07-22soldstatus $43,500
-
1998-07-24soldstatus $48,500
-
1998-06-11historical
-
1998-06-02$55,000
ⓘ Source: listings_history table (triggers on properties + properties_extension) + one-shot
backfill from property_details.listing_events for pre-trigger history.
Tax reassessment forecast IL · Partial reset (capped growth)
- Current annual tax
- $3,885 · $324/mo
- Projected year-2 tax
- $3,885 · $324/mo
- Expected delta
- $0/yr ($0/mo · 0.0%)
ⓘ Screening estimate from a state-policy table — verify with the county assessor before closing.
Climate risk First Street
- Flood 1/10 Low FEMA zone X (unshaded) · 0% chance over 30 yrs
- Wildfire 1/10 Low
- Heat 3/10 Moderate 7 d/yr ≥104°F today · 18 d/yr by 30 yrs out
- Wind 2/10 Low 100% chance of damaging wind over 30 yrs
- Air quality 2/10 Low 1 unhealthy d/yr today · 2 by 30 yrs out
Nearby sold comps map
Loading sold comps map…
Walkable amenities ~0.75 mi
Loading nearby amenities…
Taxation est. · year 1
- Rental income
- $15,938
- − Mortgage interest
- −$8,397
- − Property taxes
- −$3,885
- − Insurance
- −$750
- − Repairs & maintenance
- −$1,275
- − Management
- −$1,275
- − Depreciation
- −$4,361
- Taxable loss
- −$4,005
- Est. tax savings @ 24.0%
- +$961
- After-tax cash flow
- $-516/yr
For passive investors: Depreciation is non-cash, so a rental often shows a tax loss while cash-flowing — sheltering income. Rental losses are passive: they offset passive income freely, and up to $25,000/yr can offset ordinary (W-2) income if you actively participate and your MAGI is under $100k (phasing out to $0 by $150k); unused losses carry forward. On sale, claimed depreciation is recaptured at up to 25%, and gains may owe capital-gains tax (a 1031 exchange can defer both). Figures are a year-1 estimate at your 24.0% rate — not tax advice; consult a CPA.
Schools (NCES district)
- District
- Urbana SD 116
- NCES district ID
- 1739960
- Math proficiency
- 11% ▼ -5.00%
- Reading proficiency
- 13% ▼ -7.00%
- Median HH income
- $33,678
- Composite
- 9.72/100
- National rank
- #9830
- State rank
- #568 of 620 in IL
Livability — Urbana
- Score
- 80/100
- State rank
- #110
- US rank
- #1793
Category grades
Schools grade is shown separately in the Schools card above.
Census & demographics
- Census place
- Urbana, IL
- County
- Champaign County · 182,148 people
- City population
- 48,184
- Metro
- Champaign-Urbana, IL
- Population (ZIP)
- 27,891
- Household income
- $36,180
- Rent vs Own
- Severe rent burden
- 2719.0
Population outlook (Champaign County) Hauer SSP2
- Today (2025)
- 223,848 people
- By 2030
- 231,416 · +3.4%
- By 2040
- 244,321 · +9.1%
- By 2050
- 256,432 · +14.6%
- By 2075
- 285,823 · +27.7%
- By 2100
- 296,406 · +32.4%
Race, ethnicity, and origin ACS 2023
- Neighborhood character
- Diverse neighborhood (Simpson 0.65)
- Race & ethnicity
- White 54% Asian 17% Black 16% Hispanic / Latino 9% Two or more races 8%
- Hispanic origin (detail)
- Mexican 4% Puerto Rican 2%
- Common ancestry
- Romanian 3% Lithuanian 2% Iranian 1%
- Foreign-born
- 20% · China, Canada, Jamaica
- Languages at home
- 74% English-only · Chinese 8% Spanish 6% Other Indo-European 4%
Political lean MEDSL · Champaign
- 2024 margin
- Strong D (+24.1) · D 61.3% · R 37.2% · Other 1.5%
- 2008→2024 swing
- +6.6pp toward D · 2008: 17.5pp · 2024: 24.1pp
- All cycles
- 2024: D+24.1 2020: D+22.8 2016: D+18.4 2012: D+6.8 2008: D+17.5
Not yet ingested
- Civics
- —
Market trends
- HPI YoY
- ▼ -83.21%
- Current HPI
- 220.7438
- Rent YoY
- ▲ 4.40%
- Metro
- Champaign-Urbana, IL
- State GDP YoY
- ▲ 1.59%
- F500 in state
- 60
Industry mix (Fortune 500 HQ in IL)
| Industry | F500 HQs | Revenue |
|---|---|---|
| Insurance | 4 | $201B |
|
||
| Consumer Goods | 4 | $87B |
|
||
| Industrial Machinery | 3 | $64B |
|
||
| Healthcare | 2 | $55B |
|
||
| Retail / Pharmacy | 1 | $148B |
|
||
| Agriculture / Food | 1 | $86B |
|
||
Price history
+172.5% since first listed20 events — show timeline
- 2026-06-05 Pending — CIBR
- 2026-06-05 Pending — MRED as Distributed by MLS Grid
- 2026-05-21 Listed $149,900 CIBR
- 2026-05-08 Price Changed $149,900 MRED as Distributed by MLS Grid
- 2026-04-09 Listing Removed — MRED as Distributed by MLS Grid
- 2025-02-10 Sold (MLS) $141,000 MRED as Distributed by MLS Grid
- 2025-01-09 Contingent — MRED as Distributed by MLS Grid
- 2024-12-19 Listed $150,000 MRED as Distributed by MLS Grid
- 2013-10-03 Sold (Public Records) $64,000 Public Records
- 2013-09-30 Sold (MLS) $63,850 MRED as Distributed by MLS Grid
- 2013-09-18 Listing Removed — MRED as Distributed by MLS Grid
- 2013-06-05 Listed $69,900 MRED as Distributed by MLS Grid
- 2012-09-04 Listing Removed — MRED as Distributed by MLS Grid
- 2012-06-14 Listed — MRED as Distributed by MLS Grid
- 2012-06-01 Listing Removed — MRED as Distributed by MLS Grid
- 2011-09-02 Listed — MRED as Distributed by MLS Grid
- 2011-07-22 Sold (Public Records) $43,500 Public Records
- 1998-07-24 Sold (MLS) $48,500 MRED as Distributed by MLS Grid
- 1998-06-11 Listing Removed — MRED as Distributed by MLS Grid
- 1998-06-02 Listed $55,000 MRED as Distributed by MLS Grid
Property tax history
+3.7%/yrLatest (2025): $3,885 · +22.7% YoY. Source: county tax records.
Cash-flow waterfall
monthlySold comps — $/sqft
last 12 mo · ≤1 miLoading sold comps…