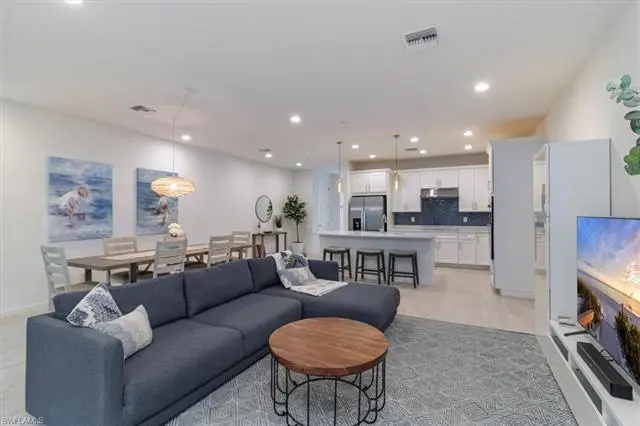
13021 Pembroke Dr
Vineyards, FL 34105
$599,000F
3 bd · 2.5 ba ·
957 sqft ·
Built 2021
· Townhouse
· Active
· 28 DOM
Cashflow @ list (25.0% down · 7.5%)
Estimated rent
$2,245/mo
Mortgage (P&I)
−$3,141
Tax + insurance
−$811
HOA
−$370
Vac / Maint / Mgmt
−$472
Net cashflow
$-2,548/mo
Annual
$-30,579/yr
Cap rate
1.49%
Cash-on-cash
-17.14%
DSCR
0.24
1% rule
0.37%
Cash to close
$167,720
Investor read
- This is a 3-bed/2.5-bath townhouse listed at $599k. Condition is rated good.
- At list price, monthly cash flow is $-3k ($-31k/yr) — negative.
- To cash-flow at today's rent, offer at most $149k (75.2% below list).
- To meet the 1% rule (rent ≥ 1% of price), the offer needs to be $225k (62.5% below list).
- It's been on market 28 days — a 2% lower offer ($590k) is reasonable based on typical stale-listing flexibility.
- Recommended offer: $149k (75.2% below list) — sets the bar for cash-flow.
- Local home prices are declining (-3.0%/yr); year-one equity from $4k of loan paydown is wiped out by about $18k of value loss. Plan a longer hold.
- Location reads 64/100 on livability (#679 in FL) — a middle-class / working-renter tenant base. Strengths: crime A+, employment A+, housing A-; Watch: health & safety D, amenities F, commute F.
- Collier (suburban): math 60% / reading 56% proficiency, ranked #16 of 73 in FL (top 22%) — acceptable for families but not a draw, mixed tenant base, ~2y average lease.
- Watch-outs: flood insurance adds $152/mo.
- Market conditions: Rents flat; 329 active listings in the ZIP; 13 comparable units currently listed for rent nearby; rentals leasing fast (median 14d on market — plan ~1-2 weeks tenant-placement turnaround); solid renter incomes; 3,520 units permitted in Collier County in 2024 (959 in 5+ unit buildings).
- Collier County population projected at +30% by 2050 — long-run rental-demand tailwind backs the buy-and-hold thesis.
- 4 sale attempts since 2y ago; this cycle's ask is 17518% above the opening price — seller raised mid-cycle; expect resistance to lowballs.
- Climate carrying-cost: in FEMA flood zone AH (mandatory federal flood insurance); severe wind risk, 99% chance of damaging wind over 30y; extreme-heat days projected 7→29/yr by 2055 (HVAC capex compounding) — expect insurance premiums to compound above CPI over the hold.
Questions for listing agent
- What do current leases actually rent for vs. the listed asking? Can we see a recent rent roll and the last 12 months of T-12 income?
- What's the actual annual flood-insurance premium (NFIP or private), and is the property in a SFHA with mandatory coverage?
- What does the HOA fee cover, when was the last increase, and are there any pending special assessments or reserve-fund shortfalls?
- Is there a deadline driving the sale (1031 exchange, divorce, estate, relocation)? That informs how much negotiation room exists.
- The area grade is low — what's the realistic commute time and amenity access for the typical tenant pool here? Any planned neighborhood developments (good or bad) we should know about?
- What's the average days-on-market for RENTAL listings here right now (not sales)? A rising rental-DOM trend means longer vacancies and softer asking-rent achievability than the comps imply.
- What's the recent tenant-quality profile in this submarket — average credit score on applications, eviction rate, late-payment / NSF rate, and stable-employment percentage? A property-management company in the area should have these aggregated.
- How much new for-sale + rental construction is in the pipeline within 1–3 miles? Heavy new supply typically softens prices + rents 12–24 months out; constrained supply supports both.
CashFlowRE · CFR-6T89C41P7MM3F4
· Data 2 days ago
cashflowre.app · 2026-05-29