13021 Pembroke Dr · Vineyards, FL
Flood risk 4/10 · Minor
- FEMA flood zone
- AH
- Chance of flooding over 30 yrs
- 0.13%
- Est. flood insurance / yr
- $1,142 – $2,507
Fire risk 1/10 · Minimal
- Est. fire insurance / yr
- $947 – $1,759
Heat risk 10/10 · Severe
- Hot days now (above 107°F)
- 7 days/yr
- Hot days in 30 yrs
- 29 days/yr
Wind risk 10/10 · Severe
- Chance of severe wind over 30 yrs
- 99.0%
Air-quality risk 2/10 · Minimal
- Unhealthy air days now
- 2 days/yr
- Unhealthy air days in 30 yrs
- 2 days/yr
Risk factors via First Street. Map © Google.
Why this score? — see what drove the F grade
The composite is a weighted blend of 9 inputs, each scored 0–100. Each bar is that input's sub-score; the figure is the points it added to the 100-point composite (weight × sub-score).
- ARV discount +7.5/15.0
- Schools +5.0/10.0
- Condition / age +4.0/5.0
- Livability +3.2/5.0
- Rent growth +2.7/5.0
- Cash flow +1.3/30.0
- 1% rule +0.0/10.0
- DSCR +0.0/10.0
- Appreciation +0.0/10.0
$599,000
🖨 Deal sheet 📄 Offer letter ✓ Due diligence
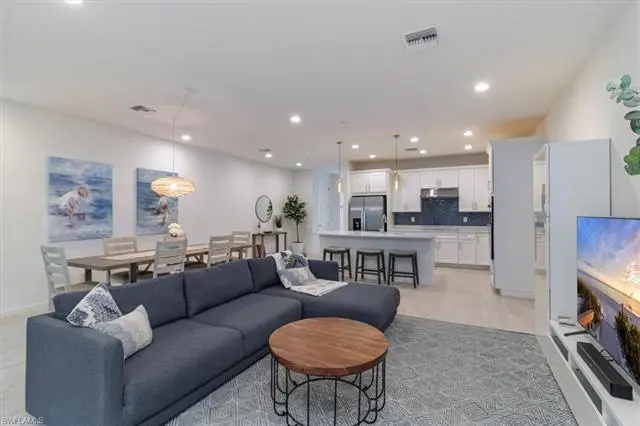
Listing remarks
"Live Life Beautifully In Southwest Florida" in this beautifully maintained home in the heart of Central Naples! Built in 2021, this spacious 3-bedroom, 2-bath residence offers modern living with low HOA fees and an unbeatable location. Conveniently situated just 25 minutes from Southwest Florida International Airport, 15 minutes to Naples’ stunning beaches, and only 15 minutes to vibrant Downtown Naples, you’ll enjoy the perfect balance of comfort and accessibility. This property is being offered with negotiable furnishings, making it an exceptional opportunity for seasonal residents, investors, or full-time homeowners looking for a move-in-ready option in one of Sout
Key facts
- $370 HOA
- Garage
- Community pool
Property features AI
Finance
- HOA & community: Mandatory HOA; Monthly master HOA fee of $381; Master HOA covers irrigation water, lawn/land maintenance, exterior pest control, recreation facilities, security, street lights, and street maintenance; Professional management; Community amenities include a community pool, sidewalks, streetlights, and underground utilities; Total annual recurring HOA fees: $4,572
Exterior
- Parking: Assigned parking (1 assigned space); Attached garage with 1 garage space; Additional 2+ parking spaces
- Security: Gated community; Security system
- Utilities: Central water; Central sewer; Cable available
- Home design: Residential townhouse (traditional style); Two-story building; Rear exposure faces north; Zero lot line
- Construction: Built in 2021; Concrete block construction; Stucco exterior finish; Tile roof; Impact-resistant doors and windows; Windows: single-hung and sliding
- Exterior features: Patio; Sprinkler system (automatic); Lake and landscaped area views; Central irrigation; Gated community
Interior
- Kitchen: Range; Microwave; Refrigerator; Freezer; Dishwasher; Disposal
- Bedrooms: 3 bedrooms plus a den
- Flooring: Carpet; Tile
- Bathrooms: 2 full bathrooms; 1 half bathroom; Master bath with dual sinks and a shower
- Heating & cooling: Central electric heat; Central electric cooling; Ceiling fans
- Interior features: Foyer; High-speed internet available; Smoke detectors; Volume/raised ceilings; Window coverings; Great room floor plan; Den/study; Guest room; Guest bath; Screened lanai/porch; Turnkey furnished
- Laundry & utility: Washer; Dryer; Laundry in residence; Auto garage door
Neighborhood map
What this means for you Summary
Snapshot
- This is a 3-bed/2.5-bath townhouse listed at $599k. Condition is rated good.
Deal economics
- At list price, monthly cash flow is $-3k ($-31k/yr) — negative.
- To cash-flow at today's rent, offer at most $149k (75.2% below list).
- To meet the 1% rule (rent ≥ 1% of price), the offer needs to be $225k (62.5% below list).
- Recommended offer: $149k (75.2% below list) — sets the bar for cash-flow.
Location & tenants
- Location reads 64/100 on livability (#679 in FL) — a middle-class / working-renter tenant base. Strengths: crime A+, employment A+, housing A-; Watch: health & safety D, amenities F, commute F.
- Collier (suburban): math 60% / reading 56% proficiency, ranked #16 of 73 in FL (top 22%) — acceptable for families but not a draw, mixed tenant base, ~2y average lease.
- Market conditions: Rents flat; 329 active listings in the ZIP; 13 comparable units currently listed for rent nearby; rentals leasing fast (median 14d on market — plan ~1-2 weeks tenant-placement turnaround); solid renter incomes; 3,520 units permitted in Collier County in 2024 (959 in 5+ unit buildings).
Forward outlook
- Local home prices are declining (-3.0%/yr); year-one equity from $4k of loan paydown is wiped out by about $18k of value loss. Plan a longer hold.
- Collier County population projected at +30% by 2050 — long-run rental-demand tailwind backs the buy-and-hold thesis.
Negotiation context
- It's been on market 28 days — a 2% lower offer ($590k) is reasonable based on typical stale-listing flexibility.
- 4 sale attempts since 2y ago; this cycle's ask is 17518% above the opening price — seller raised mid-cycle; expect resistance to lowballs.
Risks & watch-outs
- Watch-outs: flood insurance adds $152/mo.
- Climate carrying-cost: in FEMA flood zone AH (mandatory federal flood insurance); severe wind risk, 99% chance of damaging wind over 30y; extreme-heat days projected 7→29/yr by 2055 (HVAC capex compounding) — expect insurance premiums to compound above CPI over the hold.
Questions for the listing agent
- What do current leases actually rent for vs. the listed asking? Can we see a recent rent roll and the last 12 months of T-12 income?
- What's the actual annual flood-insurance premium (NFIP or private), and is the property in a SFHA with mandatory coverage?
- What does the HOA fee cover, when was the last increase, and are there any pending special assessments or reserve-fund shortfalls?
- Is there a deadline driving the sale (1031 exchange, divorce, estate, relocation)? That informs how much negotiation room exists.
- The area grade is low — what's the realistic commute time and amenity access for the typical tenant pool here? Any planned neighborhood developments (good or bad) we should know about?
- What's the average days-on-market for RENTAL listings here right now (not sales)? A rising rental-DOM trend means longer vacancies and softer asking-rent achievability than the comps imply.
- What's the recent tenant-quality profile in this submarket — average credit score on applications, eviction rate, late-payment / NSF rate, and stable-employment percentage? A property-management company in the area should have these aggregated.
- How much new for-sale + rental construction is in the pipeline within 1–3 miles? Heavy new supply typically softens prices + rents 12–24 months out; constrained supply supports both.
Investment metrics
- 1% rule
- 0.37% ✗
- Cap rate
- 1.49%
- Cash-on-cash
- -17.14%
- DSCR
- 0.24
- GRM
- 22.2
CMA / ARV
No comps found within radius.
Projected returns pro-forma
-3.0% appreciation · 0.85% rent growth · sell at horizon
- IRR
- -55.2%
- Equity multiple
- -0.57×
- Total profit
- $-263,973
- Equity at exit
- $89,313
- IRR
- —
- Equity multiple
- -1.72×
- Total profit
- $-456,947
- Equity at exit
- $51,791
Cash invested: $167,720 (down + closing). Projections, not guarantees.
Landlord ↔ Tenant lean methodology
- Overall (STATE)
- 87 Strongly Landlord-Friendly
- State Florida
- 87 Strongly Landlord-Friendly · R+3
- County
- — inherits STATE
- City
- — inherits STATE
ZIP-level market 34105
- Home prices YoY
- -30.5%
- Rents YoY
- 0.8%
- Active inventory
- 329
- Price-to-rent
- 22.2×
Monthly cashflow live
- Estimated rent
- $2,245 high interval (Pro) →
- Mortgage (P&I)
- −$3,141
- Tax from tax record
- −$409 /mo · $4,911/yr
- Insurance
- −$250
- Flood insurance flood zone
- −$152 /mo · $1,824/yr
- HOA
- −$370
- Vacancy / Maint / Mgmt
- −$472
- Net cashflow
- $-2,548
Break-even live
UW: 25.0% down · 7.5% · 30yr · 1.5% tax · 5.0% vac · 8.0% maint · 8.0% mgmt
Financing live
Cash to close
- Down payment
- $149,750
- Closing costs
- $17,970
- Reserves months
- —
- Total cash needed
- —
Loan-product check · same deal, 3 products live
Conventional
25% down · 7.5% · 30yr
- Down + closing
- —
- Monthly P&I
- —
- Monthly cashflow
- —
- DSCR
- —
- Eligible?
- —
Personal DTI + credit; lowest rate.
DSCR
20% down · 8.5% · 30yr
- Down + closing
- —
- Monthly P&I
- —
- Monthly cashflow
- —
- DSCR
- —
- Eligible?
- —
No personal income docs; deal must DSCR.
Hard money
10% down · 12.0% · 12mo
- Down + closing
- —
- Monthly P&I
- —
- Monthly cashflow
- —
- DSCR
- —
- Eligible?
- —
Short-term bridge; refi at stabilization.
Rent comps 13 comps
| Address | Beds | Baths | Sqft | Rent | $/sqft | DOM | Units | Dist |
|---|---|---|---|---|---|---|---|---|
| 3105 La Costa Cir Naples, FL | 1.0–3.0 | 1.0–2.0 | 1050 | $2,235 | $2.13 | 13d | 20 | 0.39mi |
| 1115 Reserve Ct Unit 2 Naples, FL | 2.0 | 2.0 | 1100 | $1,800 | $1.64 | 13d | 1 | 0.47mi |
| 1105 Reserve Ct #206 Naples, FL | 2.0 | 2.0 | 1100 | $2,000 | $1.82 | 13d | 1 | 0.48mi |
| 1235 Reserve Way #103 Naples, FL | 2.0 | 1.0 | 894 | $1,995 | $2.23 | 13d | 1 | 0.74mi |
| 1235 Reserve Way Naples, FL | 2.0 | 1.0 | 894 | $2,300 | $2.57 | 23d | 1 | 0.74mi |
| 1170 Reserve Way #205 Naples, FL | 2.0 | 1.0 | 894 | $1,700 | $1.90 | 23d | 1 | 0.74mi |
| 1180 Reserve Way Naples, FL | 1.0–2.0 | 1.0–2.0 | 912 | $1,990 | $2.18 | 13d | 3 | 0.76mi |
| 1180 Reserve Way Naples, FL | 1.0–2.0 | 1.0–2.0 | 954 | $2,000 | $2.10 | 23d | 2 | 0.76mi |
| 1220 Reserve Way #305 Naples, FL | 2.0 | 2.0 | 1059 | $1,950 | $1.84 | 23d | 1 | 0.77mi |
| 1190 Reserve Way #304 Naples, FL | 2.0 | 2.0 | 1059 | $2,900 | $2.74 | 23d | 1 | 0.80mi |
| 5301 Summerwind Dr Naples, FL | 1.0–2.0 | 1.0–2.0 | 836 | $1,864 | $2.23 | 13d | 12 | 0.92mi |
| 1554 Oyster Catcher Pt Unit C Naples, FL | 2.0 | 2.0 | 1124 | $2,900 | $2.58 | 23d | 1 | 1.39mi |
| 1545 Oyster Catcher Pt Unit A Naples, FL | 2.0 | 2.0 | 1124 | $2,200 | $1.96 | 13d | 1 | 1.42mi |
HOA detail
- Monthly dues
- $370 · $4,440/yr
Listing history 31 events
-
2026-06-18days on market $599,000 Active 28 DOM
-
2026-06-17days on market $599,000 Active 27 DOM
-
2026-06-16days on market $599,000 Active 26 DOM
-
2026-06-15days on market $599,000 Active 25 DOM
-
2026-06-14days on market $599,000 Active 23 DOM
-
2026-06-10days on market $599,000 Active 20 DOM
-
2026-06-09days on market $599,000 Active 19 DOM
-
2026-06-08days on market $599,000 Active 18 DOM
-
2026-06-07days on market $599,000 Active 17 DOM
-
2026-06-03days on market $599,000 Active 13 DOM
-
2026-06-02days on market $599,000 Active 12 DOM
-
2026-06-01days on market $599,000 Active 11 DOM
-
2026-05-31days on market $599,000 Active 10 DOM
-
2026-05-30days on market $599,000 Active 9 DOM
-
2026-05-22$3,400
-
2026-05-21$599,000 Active
-
2024-08-07historical $3,400
-
2024-07-09$3,400
-
2024-06-21historical $3,400
-
2024-05-21$3,400
-
2021-02-20price $462,495
-
2021-02-07price $457,495
-
2021-01-30price $432,495
-
2020-12-13price $418,495
-
2020-12-05price $413,495
-
2020-11-14price $408,495
-
2020-11-02price $406,995
-
2020-10-31price $406,073
-
2020-10-24price $401,073
-
2020-09-06price $384,495
-
2020-09-06price $354,495
ⓘ Source: listings_history table (triggers on properties + properties_extension) + one-shot
backfill from property_details.listing_events for pre-trigger history.
Tax reassessment forecast FL · Resets to sale price
- Current annual tax
- $4,911 · $409/mo
- Projected year-2 tax
- $4,972 · $414/mo
- Expected delta
- +$60/yr (+$5/mo · 1.2%)
ⓘ Screening estimate from a state-policy table — verify with the county assessor before closing.
Climate risk First Street
- Flood 4/10 Moderate FEMA zone AH · 13% chance over 30 yrs
- Wildfire 1/10 Low
- Heat 10/10 Extreme 7 d/yr ≥107°F today · 29 d/yr by 30 yrs out
- Wind 10/10 Extreme 99% chance of damaging wind over 30 yrs
- Air quality 2/10 Low 2 unhealthy d/yr today · 2 by 30 yrs out
Nearby sold comps map
Loading sold comps map…
Walkable amenities ~0.75 mi
Loading nearby amenities…
Taxation est. · year 1
- Rental income
- $26,945
- − Mortgage interest
- −$33,553
- − Property taxes
- −$4,911
- − Insurance
- −$4,820
- − Repairs & maintenance
- −$2,156
- − Management
- −$2,156
- − HOA
- −$4,440
- − Depreciation
- −$17,425
- Taxable loss
- −$42,516
- Est. tax savings @ 24.0%
- +$10,204
- After-tax cash flow
- $-20,375/yr
For passive investors: Depreciation is non-cash, so a rental often shows a tax loss while cash-flowing — sheltering income. Rental losses are passive: they offset passive income freely, and up to $25,000/yr can offset ordinary (W-2) income if you actively participate and your MAGI is under $100k (phasing out to $0 by $150k); unused losses carry forward. On sale, claimed depreciation is recaptured at up to 25%, and gains may owe capital-gains tax (a 1031 exchange can defer both). Figures are a year-1 estimate at your 24.0% rate — not tax advice; consult a CPA.
Condition & rehab AI · 12 photos
This move-in-ready townhouse in Central Naples offers modern amenities and a prime location, making it an excellent investment opportunity.
Value-add opportunities
- Both landscaping — enhances curb appeal and adds value
- Both smart home integration — increases convenience and marketability
Renovation cost estimate screening
Value-add ROI direction
- Both landscaping — enhances curb appeal and adds value ↑
- Both smart home integration — increases convenience and marketability ↑
ⓘ Cost ranges are severity-bucket heuristics (US national rule-of-thumb). Get contractor quotes + a written scope before underwriting a rehab budget.
Schools (NCES district)
- District
- Collier
- NCES district ID
- 1200330
- Math proficiency
- 60% ▼ -4.00%
- Reading proficiency
- 56% ▼ -2.00%
- Median HH income
- $58,275
- Composite
- 50.23/100
- National rank
- #1892
- State rank
- #16 of 73 in FL
Livability — Vineyards
- Score
- 64/100
- State rank
- #679
- US rank
- #14101
Category grades
Schools grade is shown separately in the Schools card above.
Census & demographics
- County
- Collier County · 396,295 people
- Metro
- Naples-Marco Island, FL
- Population (ZIP)
- 15,441
- Household income
- $92,214
- Rent vs Own
- Severe rent burden
- 780.0
Population outlook (Collier County) Hauer SSP2
- Today (2025)
- 420,858 people
- By 2030
- 450,054 · +6.9%
- By 2040
- 502,232 · +19.3%
- By 2050
- 544,932 · +29.5%
- By 2075
- 627,203 · +49.0%
- By 2100
- 659,015 · +56.6%
Race, ethnicity, and origin ACS 2023
- Neighborhood character
- Predominantly White (79%)
- Race & ethnicity
- White 79% Hispanic / Latino 14% Two or more races 7% Asian 5%
- Hispanic origin (detail)
- Mexican 3% Puerto Rican 1% Cuban 3% Salvadoran 1%
- Common ancestry
- Romanian 3% Lithuanian 3% Italian 3%
- Foreign-born
- 22% · Canada, China, Jamaica
- Languages at home
- 77% English-only · Spanish 11% Other Indo-European 3% Russian/Polish/Slavic 3%
Political lean MEDSL · Collier
- 2024 margin
- Solid R (+33.1) · D 33.1% · R 66.2%
- 2008→2024 swing
- -10.6pp toward R · 2008: -22.5pp · 2024: -33.1pp
- All cycles
- 2024: R+33.1 2020: R+24.7 2016: R+26.0 2012: R+30.1 2008: R+22.5
Not yet ingested
- Civics
- —
Market trends
- HPI YoY
- ▼ -124.65%
- Current HPI
- 283.9084
- Rent YoY
- ▲ 0.85%
- Metro
- Naples-Marco Island, FL
- State GDP YoY
- ▲ 3.28%
- F500 in state
- 36
Industry mix (Fortune 500 HQ in FL)
| Industry | F500 HQs | Revenue |
|---|---|---|
| Industrial Technology | 2 | $29B |
|
||
| Insurance | 2 | $17B |
|
||
| Retail | 1 | $60B |
|
||
| Technology Distribution | 1 | $58B |
|
||
| Homebuilding | 1 | $35B |
|
||
| Technology Manufacturing | 1 | $35B |
|
||
Price history
-99.0% since first listed17 events — show timeline
- 2026-05-22 Listed for Rent $3,400 NAPLESMLS
- 2026-05-21 Listed $599,000 NAPLESMLS
- 2024-08-07 Rental Removed $3,400 NAPLESMLS
- 2024-07-09 Listed for Rent $3,400 NAPLESMLS
- 2024-06-21 Rental Removed $3,400 RENT.
- 2024-05-21 Listed for Rent $3,400 RENT.
- 2021-02-20 Price Changed $462,495 NAPLESMLS
- 2021-02-07 Price Changed $457,495 NAPLESMLS
- 2021-01-30 Price Changed $432,495 NAPLESMLS
- 2020-12-13 Price Changed $418,495 NAPLESMLS
- 2020-12-05 Price Changed $413,495 NAPLESMLS
- 2020-11-14 Price Changed $408,495 NAPLESMLS
- 2020-11-02 Price Changed $406,995 NAPLESMLS
- 2020-10-31 Price Changed $406,073 NAPLESMLS
- 2020-10-24 Price Changed $401,073 NAPLESMLS
- 2020-09-06 Price Changed $384,495 NAPLESMLS
- 2020-09-06 Price Changed $354,495 NAPLESMLS
Property tax history
+58.7%/yrLatest (2025): $4,911 · +4.3% YoY. Source: county tax records.
Cash-flow waterfall
monthlySold comps — $/sqft
last 12 mo · ≤1 miLoading sold comps…