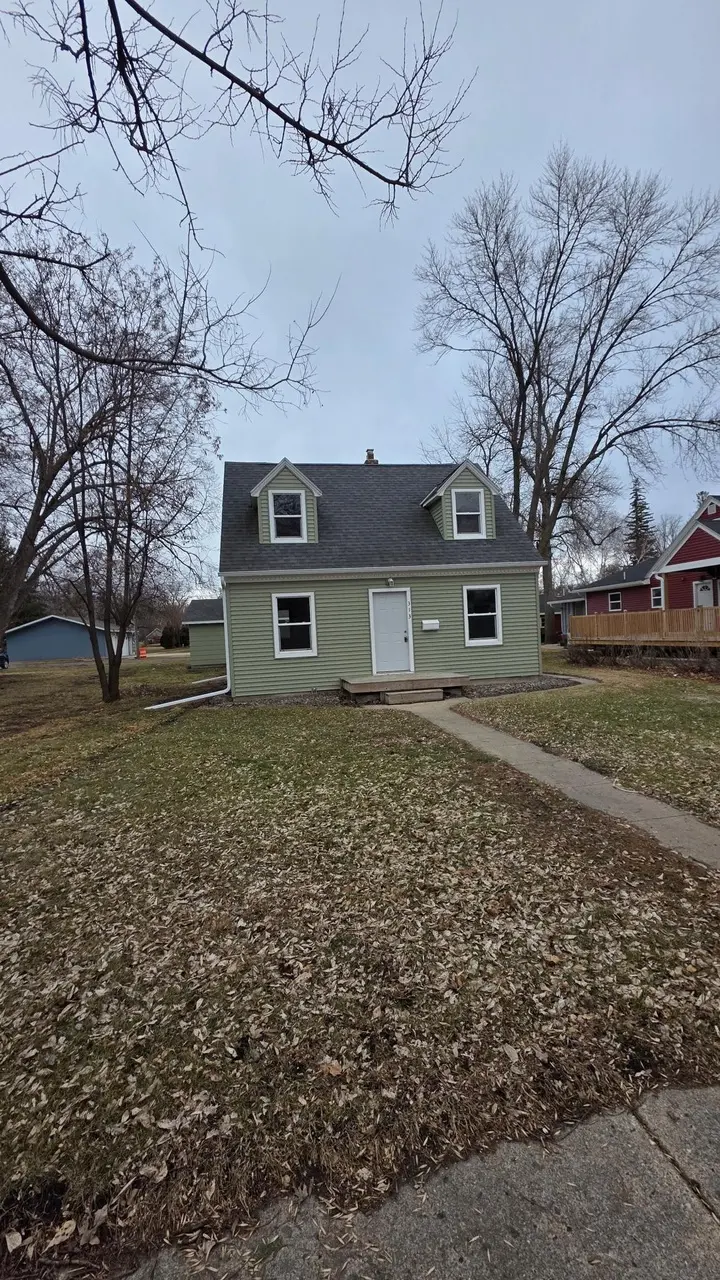
313 11th St S
Benson, MN 56215
$149,000D
3 bd · 2.0 ba ·
1,404 sqft ·
Built 1938
· SingleFamily
· Active
· 98 DOM
Cashflow @ list (25.0% down · 7.5%)
Estimated rent
$1,156/mo
Mortgage (P&I)
−$781
Tax + insurance
−$188
HOA
−$0
Vac / Maint / Mgmt
−$243
Net cashflow
$-56/mo
Annual
$-674/yr
Cap rate
5.84%
Cash-on-cash
-1.62%
DSCR
0.93
1% rule
0.78%
Cash to close
$41,720
Investor read
- This is a 3-bed/2.0-bath single-family listed at $149k.
- At list price, monthly cash flow is $-56 ($-674/yr) — negative.
- To cash-flow at today's rent, offer at most $139k (6.7% below list).
- To meet the 1% rule (rent ≥ 1% of price), the offer needs to be $116k (22.4% below list).
- It's been on market 98 days — a 9% lower offer ($136k) is reasonable based on typical stale-listing flexibility.
- Recommended offer: $116k (22.4% below list) — sets the bar for 1% rule.
- Local home prices are declining (-3.0%/yr); year-one equity from $1k of loan paydown is wiped out by about $4k of value loss. Plan a longer hold.
- Location reads 75/100 on livability (#189 in MN, #4,068 nationally) — a middle-class / working-renter tenant base. Strengths: crime A+, cost of living A+, housing A+; Watch: employment C-, amenities F, commute F.
- Benson Public School District (town): math 37% / reading 41% proficiency, ranked #228 of 301 in MN (top 76%) — families likely to look elsewhere, expect single-tenant / working-renter base with shorter leases.
- Zoned schools: Northside Elementary (math 52% / reading 52%, grade C-, #368 of 857 statewide, top 47%, 406 students, 54% FRL); Benson Secondary (math 30% / reading 35%, grade F, #332 of 471 statewide, top 70%, 353 students, 45% FRL) — zoned schools average 50% FRL vs 25% district-wide (24 pts higher); higher-poverty schools than district average — tighter screening recommended.
- Watch-outs: built in 1938 — expect roof / HVAC / electrical / plumbing capex.
- Market conditions: 32 active listings in the ZIP; 3 comparable units currently listed for rent nearby; rentals lingering (median 46d on market — plan ~5-8 weeks vacancy on turnover, expect pricing pressure); 100% of comp listings sitting > 30 days — soft ceiling on asking rent; 15 units permitted in Swift County in 2024 (0 in 5+ unit buildings).
- Swift County population projected at -20% by 2050 — secular population decline; favor cash flow + early exit over multi-decade hold.
- 2 sale attempts; this cycle's ask has dropped $10k (6%) from the opening price — seller is motivated, your offer sets the floor, not the list.
- Climate carrying-cost: major flood risk — expect insurance premiums to compound above CPI over the hold.
Questions for listing agent
- What do current leases actually rent for vs. the listed asking? Can we see a recent rent roll and the last 12 months of T-12 income?
- It's been on market 98 days. Have you received any prior offers? Is the seller open to a 22% concession, seller financing, or rate buy-down credit?
- Built in 1938 — when were the roof, HVAC, electrical panel, plumbing, and water heater last replaced?
- Why hasn't it sold? Are there any deal-killer items the seller is aware of (foundation, flood, title, zoning, code violations)?
- Is there a deadline driving the sale (1031 exchange, divorce, estate, relocation)? That informs how much negotiation room exists.
- The area grade is low — what's the realistic commute time and amenity access for the typical tenant pool here? Any planned neighborhood developments (good or bad) we should know about?
- What's the average days-on-market for RENTAL listings here right now (not sales)? A rising rental-DOM trend means longer vacancies and softer asking-rent achievability than the comps imply.
- What's the recent tenant-quality profile in this submarket — average credit score on applications, eviction rate, late-payment / NSF rate, and stable-employment percentage? A property-management company in the area should have these aggregated.
CashFlowRE · CFR-6TEJ7Z5VDJ6RZM
· Data 3 h ago
cashflowre.app · 2026-05-29