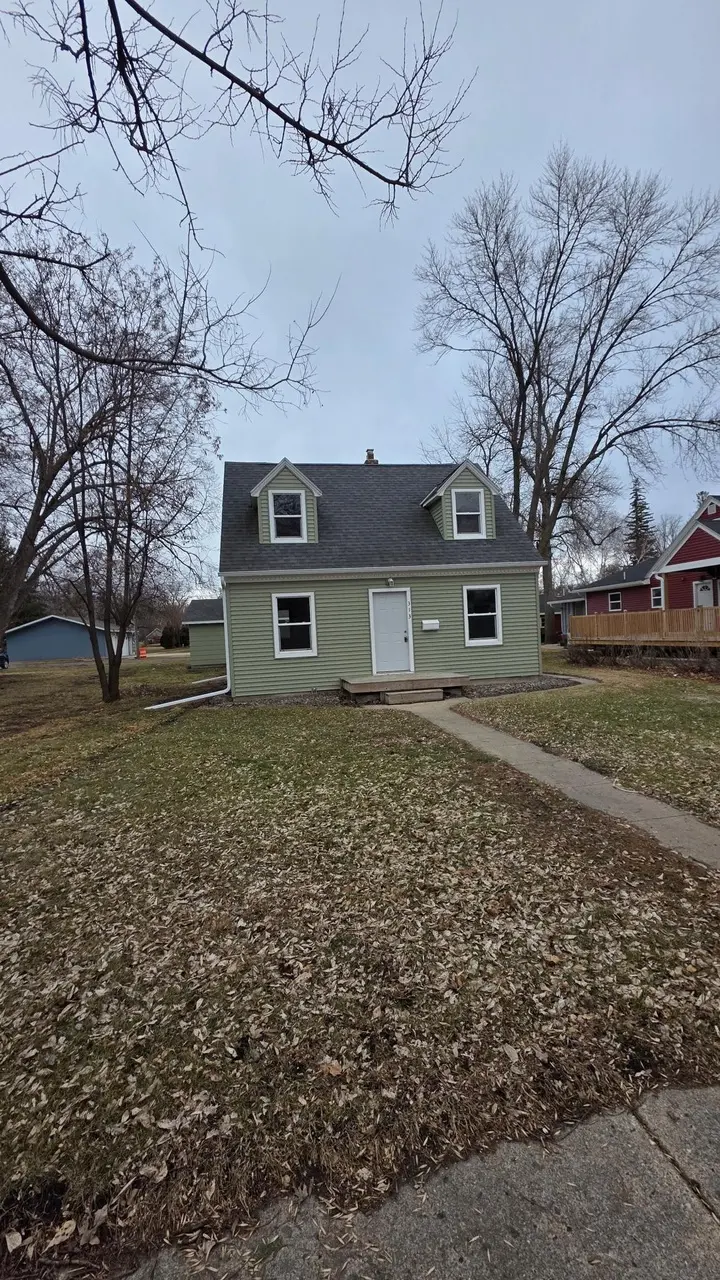
313 11th St S · Benson, MN
Flood risk 6/10 · Moderate
- FEMA flood zone
- X (unshaded)
- Chance of flooding over 30 yrs
- 0.72%
- Est. flood insurance / yr
- $473 – $860
Fire risk 3/10 · Minor
- Est. fire insurance / yr
- $888 – $1,650
Heat risk 2/10 · Minimal
- Hot days now (above 99°F)
- 7 days/yr
- Hot days in 30 yrs
- 13 days/yr
Wind risk 2/10 · Minimal
- Chance of severe wind over 30 yrs
- —
Air-quality risk 2/10 · Minimal
- Unhealthy air days now
- 2 days/yr
- Unhealthy air days in 30 yrs
- 2 days/yr
Risk factors via First Street. Map © Google.
Why this score? — see what drove the D grade
The composite is a weighted blend of 9 inputs, each scored 0–100. Each bar is that input's sub-score; the figure is the points it added to the 100-point composite (weight × sub-score).
- ARV discount +15.0/15.0
- Cash flow +11.2/30.0
- Livability +3.8/5.0
- Schools +3.4/10.0
- DSCR +3.3/10.0
- 1% rule +2.8/10.0
- Rent growth +2.5/5.0
- Condition / age +2.5/5.0
- Appreciation +0.0/10.0
$149,000
🖨 Deal sheet (PDF) 📄 Offer letter ✓ Due diligence
Listing remarks MLS
This 3 bedroom - 2 bath house offers comfortable living and ample space for your family. The main level features hardwood floor in dedicated dining room and carpet in living room. Relax and entertain in the cozy living room or hide in the additional family room with 3/4 bath in lower level. Outside the home is an oversized double garage, providing plenty of room for vehicles, storage, and possibly a work space. Home offers many updates this last year and qualifies for Minnesota Housing & Finance Agency loan. One of the owners is a licensed Real Estate Agent in the state of Minnesota.
Key facts
- 7,666 sq ft lot
- 2 garage spots
- Built 1938
Neighborhood map
What this means for you Summary
Snapshot
- This is a 3-bed/2.0-bath single-family listed at $149k.
Deal economics
- At list price, monthly cash flow is $-56 ($-674/yr) — negative.
- To cash-flow at today's rent, offer at most $139k (6.7% below list).
- To meet the 1% rule (rent ≥ 1% of price), the offer needs to be $116k (22.4% below list).
- Recommended offer: $116k (22.4% below list) — sets the bar for 1% rule.
Location & tenants
- Location reads 75/100 on livability (#189 in MN, #4,068 nationally) — a middle-class / working-renter tenant base. Strengths: crime A+, cost of living A+, housing A+; Watch: employment C-, amenities F, commute F.
- Benson Public School District (town): math 37% / reading 41% proficiency, ranked #228 of 301 in MN (top 76%) — families likely to look elsewhere, expect single-tenant / working-renter base with shorter leases.
- Zoned schools: Northside Elementary (math 52% / reading 52%, grade C-, #368 of 857 statewide, top 47%, 406 students, 54% FRL); Benson Secondary (math 30% / reading 35%, grade F, #332 of 471 statewide, top 70%, 353 students, 45% FRL) — zoned schools average 50% FRL vs 25% district-wide (24 pts higher); higher-poverty schools than district average — tighter screening recommended.
- Market conditions: 32 active listings in the ZIP; 3 comparable units currently listed for rent nearby; rentals lingering (median 46d on market — plan ~5-8 weeks vacancy on turnover, expect pricing pressure); 100% of comp listings sitting > 30 days — soft ceiling on asking rent; 15 units permitted in Swift County in 2024 (0 in 5+ unit buildings).
Forward outlook
- Local home prices are declining (-3.0%/yr); year-one equity from $1k of loan paydown is wiped out by about $4k of value loss. Plan a longer hold.
- Swift County population projected at -20% by 2050 — secular population decline; favor cash flow + early exit over multi-decade hold.
Negotiation context
- It's been on market 97 days — a 9% lower offer ($136k) is reasonable based on typical stale-listing flexibility.
- 2 sale attempts; this cycle's ask has dropped $10k (6%) from the opening price — seller is motivated, your offer sets the floor, not the list.
Risks & watch-outs
- Watch-outs: built in 1938 — expect roof / HVAC / electrical / plumbing capex.
- Climate carrying-cost: major flood risk — expect insurance premiums to compound above CPI over the hold.
Questions for the listing agent
- What do current leases actually rent for vs. the listed asking? Can we see a recent rent roll and the last 12 months of T-12 income?
- It's been on market 97 days. Have you received any prior offers? Is the seller open to a 22% concession, seller financing, or rate buy-down credit?
- Built in 1938 — when were the roof, HVAC, electrical panel, plumbing, and water heater last replaced?
- Why hasn't it sold? Are there any deal-killer items the seller is aware of (foundation, flood, title, zoning, code violations)?
- Is there a deadline driving the sale (1031 exchange, divorce, estate, relocation)? That informs how much negotiation room exists.
- The area grade is low — what's the realistic commute time and amenity access for the typical tenant pool here? Any planned neighborhood developments (good or bad) we should know about?
- What's the average days-on-market for RENTAL listings here right now (not sales)? A rising rental-DOM trend means longer vacancies and softer asking-rent achievability than the comps imply.
- What's the recent tenant-quality profile in this submarket — average credit score on applications, eviction rate, late-payment / NSF rate, and stable-employment percentage? A property-management company in the area should have these aggregated.
- How much new for-sale + rental construction is in the pipeline within 1–3 miles? Heavy new supply typically softens prices + rents 12–24 months out; constrained supply supports both.
Investment metrics
- 1% rule
- 0.78% ✗
- Cap rate
- 5.84%
- Cash-on-cash
- -1.62%
- DSCR
- 0.93
- GRM
- 10.7
CMA / ARV
- ARV (median comp)
- $252,911
- List price
- $149,000
- Delta
- -41.09%
- Verdict
- UNDERPRICED
- Comps
- 1 within 2.0 mi
Projected returns pro-forma
-3.0% appreciation · 3.0% rent growth · sell at horizon
- IRR
- -19.0%
- Equity multiple
- 0.34×
- Total profit
- $-27,742
- Equity at exit
- $22,216
- IRR
- -11.6%
- Equity multiple
- 0.31×
- Total profit
- $-28,844
- Equity at exit
- $12,883
Cash invested: $41,720 (down + closing). Projections, not guarantees.
Landlord ↔ Tenant lean methodology
- Overall (STATE)
- 46 Balanced
- State Minnesota
- 46 Balanced · D+2
- County
- — inherits STATE
- City
- — inherits STATE
ZIP-level market 56215
- Home prices YoY
- -18.0%
- Active inventory
- 32
- Price-to-rent
- 10.7×
Monthly cashflow live
- Estimated rent
- $1,156 medium interval (Pro) →
- Mortgage (P&I)
- −$781
- Tax from tax record
- −$126 /mo · $1,514/yr
- Insurance
- −$62
- HOA
- −$0
- Vacancy / Maint / Mgmt
- −$243
- Net cashflow
- $-56
Break-even live
Sensitivity live
| Price | -10% $28 | -5% $-14 | +0% $-56 | +5% $-98 | +10% $-141 |
|---|---|---|---|---|---|
| Rent | -10% $-148 | -5% $-102 | +0% $-56 | +5% $-11 | +10% $35 |
| Rate | -1.0pp $19 | -0.5pp $-18 | base $-56 | +0.5pp $-95 | +1.0pp $-134 |
UW: 25.0% down · 7.5% · 30yr · 1.5% tax · 5.0% vac · 8.0% maint · 8.0% mgmt
Financing live
Cash to close
- Down payment
- $37,250
- Closing costs
- $4,470
- Reserves months
- —
- Total cash needed
- —
Loan-product check · same deal, 3 products live
Conventional
25% down · 7.5% · 30yr
- Down + closing
- —
- Monthly P&I
- —
- Monthly cashflow
- —
- DSCR
- —
- Eligible?
- —
Personal DTI + credit; lowest rate.
DSCR
20% down · 8.5% · 30yr
- Down + closing
- —
- Monthly P&I
- —
- Monthly cashflow
- —
- DSCR
- —
- Eligible?
- —
No personal income docs; deal must DSCR.
Hard money
10% down · 12.0% · 12mo
- Down + closing
- —
- Monthly P&I
- —
- Monthly cashflow
- —
- DSCR
- —
- Eligible?
- —
Short-term bridge; refi at stabilization.
Rent comps 3 comps
| Address | Beds | Baths | Sqft | Rent | $/sqft | DOM | Units | Dist |
|---|---|---|---|---|---|---|---|---|
| 1017 13th St N Benson, MN | 2.0 | 1.5 | 964 | $1,140 | $1.18 | 45d | 1 | 0.83mi |
| 1009 13th St N Benson, MN | 2.0 | 1.5 | 964 | $1,090 | $1.13 | 45d | 1 | 0.83mi |
| 1027 13th St N Benson, MN | 3.0 | 1.5 | 964 | $1,240 | $1.29 | 45d | 1 | 0.84mi |
Listing history 24 events
-
2026-06-21days on market $149,000 Active 97 DOM
-
2026-06-21days on market $149,000 Active 96 DOM
-
2026-06-18days on market $149,000 Active 94 DOM
-
2026-06-17days on market $149,000 Active 93 DOM
-
2026-06-16days on market $149,000 Active 92 DOM
-
2026-06-15days on market $149,000 Active 91 DOM
-
2026-06-13days on market $149,000 Active 89 DOM
-
2026-06-12days on market $149,000 Active 88 DOM
-
2026-06-09days on market $149,000 Active 85 DOM
-
2026-06-08days on market $149,000 Active 84 DOM
-
2026-06-07days on market $149,000 Active 83 DOM
-
2026-06-05remarks 686-char remark
-
2026-06-05days on market $149,000 Active 81 DOM
-
2026-06-04days on market $149,000 Active 79 DOM
-
2026-06-02days on market $149,000 Active 78 DOM
-
2026-06-01days on market $149,000 Active 77 DOM
-
2026-05-31days on market $149,000 Active 76 DOM
-
2026-05-31days on market $149,000 Active 75 DOM
-
2026-05-07price $149,000 594-char remark
Show marketing remark (594 chars)
This 3 bedroom - 2 bath house offers comfortable living and ample space for your family. The main level features hardwood floor in dedicated dining room and carpet in living room. Relax and entertain in the cozy living room or hide in the additional family room with 3/4 bath in lower level. Outside the home is an oversized double garage, providing plenty of room for vehicles, storage, and possibly a work space. Home offers many updates this last year and qualifies for Minnesota Housing & Finance Agency loan. One of the owners is a licensed Real Estate Agent in the state of Minnesota.
-
2026-03-16$159,000 Active 594-char remark
Show marketing remark (594 chars)
This 3 bedroom - 2 bath house offers comfortable living and ample space for your family. The main level features hardwood floor in dedicated dining room and carpet in living room. Relax and entertain in the cozy living room or hide in the additional family room with 3/4 bath in lower level. Outside the home is an oversized double garage, providing plenty of room for vehicles, storage, and possibly a work space. Home offers many updates this last year and qualifies for Minnesota Housing & Finance Agency loan. One of the owners is a licensed Real Estate Agent in the state of Minnesota.
-
2026-03-01historical
-
2025-11-01price $159,900
-
2025-10-19$169,000 Active
-
2025-10-16historical
ⓘ Source: listings_history table (triggers on properties + properties_extension) + one-shot
backfill from property_details.listing_events for pre-trigger history.
Tax reassessment forecast MN · Partial reset (capped growth)
- Current annual tax
- $1,514 · $126/mo
- Projected year-2 tax
- $1,591 · $133/mo
- Expected delta
- +$77/yr (+$6/mo · 5.1%)
ⓘ Screening estimate from a state-policy table — verify with the county assessor before closing.
Climate risk First Street
- Flood 6/10 Major FEMA zone X (unshaded) · 72% chance over 30 yrs
- Wildfire 3/10 Moderate
- Heat 2/10 Low 7 d/yr ≥99°F today · 13 d/yr by 30 yrs out
- Wind 2/10 Low
- Air quality 2/10 Low 2 unhealthy d/yr today · 2 by 30 yrs out
Nearby sold comps map
Loading sold comps map…
Walkable amenities ~0.75 mi
Loading nearby amenities…
Taxation est. · year 1
- Rental income
- $13,875
- − Mortgage interest
- −$8,346
- − Property taxes
- −$1,514
- − Insurance
- −$745
- − Repairs & maintenance
- −$1,110
- − Management
- −$1,110
- − Depreciation
- −$4,335
- Taxable loss
- −$3,285
- Est. tax savings @ 24.0%
- +$788
- After-tax cash flow
- $114/yr
For passive investors: Depreciation is non-cash, so a rental often shows a tax loss while cash-flowing — sheltering income. Rental losses are passive: they offset passive income freely, and up to $25,000/yr can offset ordinary (W-2) income if you actively participate and your MAGI is under $100k (phasing out to $0 by $150k); unused losses carry forward. On sale, claimed depreciation is recaptured at up to 25%, and gains may owe capital-gains tax (a 1031 exchange can defer both). Figures are a year-1 estimate at your 24.0% rate — not tax advice; consult a CPA.
Schools (NCES district)
- District
- Benson Public School District
- NCES district ID
- 2704470
- Math proficiency
- 37% ▼ -13.00%
- Reading proficiency
- 41% ▼ -9.00%
- Median HH income
- $49,024
- Composite
- 33.56/100
- National rank
- #5423
- State rank
- #228 of 301 in MN
Livability — Benson
- Score
- 75/100
- State rank
- #189
- US rank
- #4068
Category grades
Schools grade is shown separately in the Schools card above.
Census & demographics
- Census place
- Benson, MN
- Population (ZIP)
- 4,701
Population outlook (Swift County) Hauer SSP2
- Today (2025)
- 8,635 people
- By 2030
- 8,257 · -4.4%
- By 2040
- 7,528 · -12.8%
- By 2050
- 6,891 · -20.2%
- By 2075
- 5,879 · -31.9%
- By 2100
- 5,045 · -41.6%
Race, ethnicity, and origin ACS 2023
- Neighborhood character
- Predominantly White (88%)
- Race & ethnicity
- White 88% Hispanic / Latino 6% Two or more races 6% Black 1%
- Hispanic origin (detail)
- Mexican 3%
- Common ancestry
- Portuguese 28% Italian 3% Romanian 3%
- Foreign-born
- 1% · Canada
- Languages at home
- 97% English-only · Spanish 2%
Political lean MEDSL · Swift
- 2024 margin
- Solid R (+34.2) · D 32.1% · R 66.3% · Other 1.6%
- 2008→2024 swing
- -47.9pp toward R · 2008: 13.8pp · 2024: -34.2pp
- All cycles
- 2024: R+34.2 2020: R+29.5 2016: R+25.8 2012: D+9.9 2008: D+13.8
Not yet ingested
- Civics
- —
Market trends
- HPI YoY
- ▼ -47.08%
- Current HPI
- 214.9157
- Rent YoY
- —
- Metro
- —
- State GDP YoY
- ▲ 2.41%
- F500 in state
- 34
Industry mix (Fortune 500 HQ in MN)
| Industry | F500 HQs | Revenue |
|---|---|---|
| Healthcare | 2 | $407B |
|
||
| Retail | 2 | $150B |
|
||
| Consumer Goods | 2 | $32B |
|
||
| Industrial Machinery | 2 | $6B |
|
||
| Agriculture | 1 | $40B |
|
||
| Healthcare / Medical Devices | 1 | $32B |
|
||
Price history
-11.8% since first listed6 events — show timeline
- 2026-05-07 Price Changed $149,000 NORTHSTARMLS as Distributed by MLS Grid
- 2026-03-16 Listed $159,000 NORTHSTARMLS as Distributed by MLS Grid
- 2026-03-01 Listing Removed — NORTHSTARMLS as Distributed by MLS Grid
- 2025-11-01 Price Changed $159,900 NORTHSTARMLS as Distributed by MLS Grid
- 2025-10-19 Listed $169,000 NORTHSTARMLS as Distributed by MLS Grid
- 2025-10-16 Coming Soon — NORTHSTARMLS as Distributed by MLS Grid
Property tax history
+5.1%/yrLatest (2025): $1,514 · +5.9% YoY. Source: county tax records.
Cash-flow waterfall
monthlySold comps — $/sqft
last 12 mo · ≤1 miLoading sold comps…