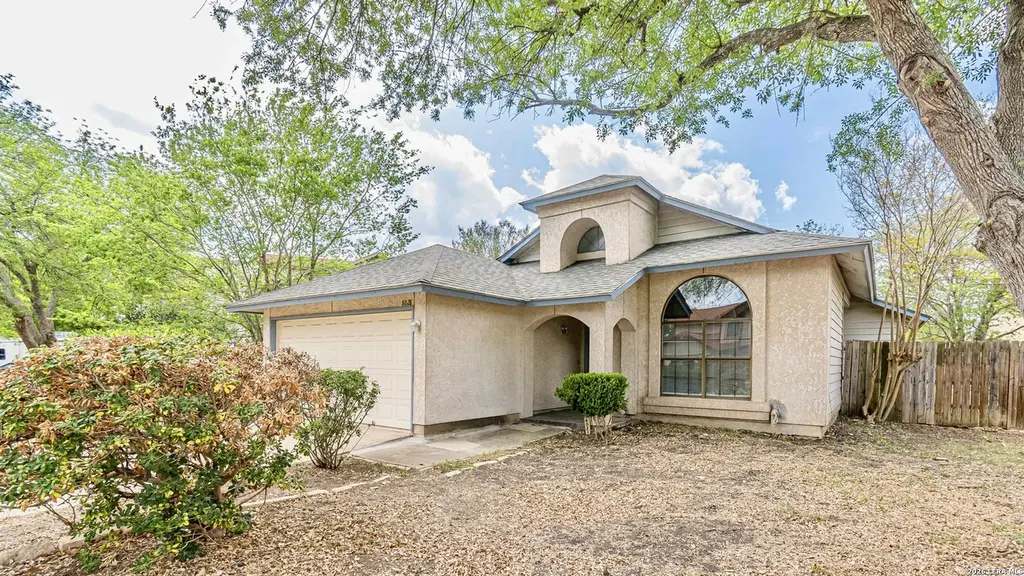
8023 Copper Trl
Converse, TX 78244
$217,000D-
3 bd · 2.0 ba ·
1,774 sqft ·
Built 1986
· SingleFamily
· Pending
· 69 DOM
Cashflow @ list (25.0% down · 7.5%)
Estimated rent
$1,762/mo
Mortgage (P&I)
−$1,138
Tax + insurance
−$356
HOA
−$0
Vac / Maint / Mgmt
−$370
Net cashflow
$-103/mo
Annual
$-1,231/yr
Cap rate
5.73%
Cash-on-cash
-2.03%
DSCR
0.91
1% rule
0.81%
Cash to close
$60,760
Investor read
- This is a 3-bed/2.0-bath single-family listed at $217k.
- At list price, monthly cash flow is $-103 ($-1k/yr) — negative.
- To cash-flow at today's rent, offer at most $199k (8.3% below list).
- To meet the 1% rule (rent ≥ 1% of price), the offer needs to be $176k (18.8% below list).
- It's been on market 69 days — a 6% lower offer ($204k) is reasonable based on typical stale-listing flexibility.
- Recommended offer: $176k (18.8% below list) — sets the bar for 1% rule.
- Local home prices are declining (-3.0%/yr); year-one equity from $2k of loan paydown is wiped out by about $7k of value loss. Plan a longer hold.
- Location reads 66/100 on livability (#649 in TX) — a middle-class / working-renter tenant base. Strengths: cost of living A+, housing A+, employment B; Watch: schools C-, crime C-, amenities F.
- Judson ISD (suburban): math 21% / reading 33% proficiency, ranked #660 of 826 in TX (top 80%) — low school quality limits family demand, transient renter base, plan for 1-2y turnover.
- Market conditions: Rents flat; 187 active listings in the ZIP; 40 comparable units currently listed for rent nearby; rentals at typical pace (median 24d on market — plan ~3-4 weeks tenant-placement turnaround); 8,308 units permitted in Bexar County in 2024 (2,506 in 5+ unit buildings).
- Bexar County population projected at +50% by 2050 — long-run rental-demand tailwind backs the buy-and-hold thesis.
- 3 sale attempts since 9y ago with the ask held roughly flat each time — persistent listings suggest the price (not the market) is what's stuck; bring a comps-based counter.
- Climate carrying-cost: severe wind risk, 80% chance of damaging wind over 30y; extreme-heat days projected 7→22/yr by 2055 (HVAC capex compounding) — expect insurance premiums to compound above CPI over the hold.
- Cap rate 5.7% vs local median 4.4% in Converse — meaningfully above typical; check what's discounted (condition, days-on-market, listing class) to confirm the premium yield is real.
Questions for listing agent
- What do current leases actually rent for vs. the listed asking? Can we see a recent rent roll and the last 12 months of T-12 income?
- It's been on market 69 days. Have you received any prior offers? Is the seller open to a 19% concession, seller financing, or rate buy-down credit?
- Why hasn't it sold? Are there any deal-killer items the seller is aware of (foundation, flood, title, zoning, code violations)?
- Is there a deadline driving the sale (1031 exchange, divorce, estate, relocation)? That informs how much negotiation room exists.
- The area grade is low — what's the realistic commute time and amenity access for the typical tenant pool here? Any planned neighborhood developments (good or bad) we should know about?
- What's the average days-on-market for RENTAL listings here right now (not sales)? A rising rental-DOM trend means longer vacancies and softer asking-rent achievability than the comps imply.
- What's the recent tenant-quality profile in this submarket — average credit score on applications, eviction rate, late-payment / NSF rate, and stable-employment percentage? A property-management company in the area should have these aggregated.
- How much new for-sale + rental construction is in the pipeline within 1–3 miles? Heavy new supply typically softens prices + rents 12–24 months out; constrained supply supports both.
CashFlowRE · CFR-6V9SF90TAF6FGA
· Data 6 days ago
cashflowre.app · 2026-05-29