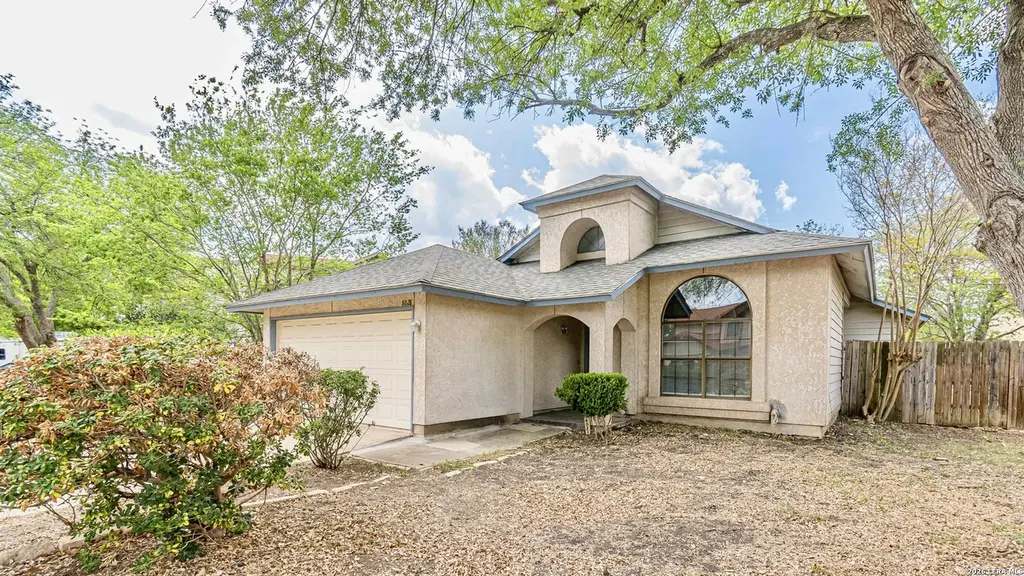
8023 Copper Trl · Converse, TX
Flood risk 1/10 · Minimal
- FEMA flood zone
- X (unshaded)
- Chance of flooding over 30 yrs
- 0.0%
- Est. flood insurance / yr
- $507 – $1,088
Fire risk 4/10 · Minor
- Est. fire insurance / yr
- $1,222 – $2,270
Heat risk 8/10 · Major
- Hot days now (above 108°F)
- 7 days/yr
- Hot days in 30 yrs
- 22 days/yr
Wind risk 8/10 · Major
- Chance of severe wind over 30 yrs
- 80.0%
Air-quality risk 1/10 · Minimal
- Unhealthy air days now
- 0 days/yr
- Unhealthy air days in 30 yrs
- 0 days/yr
Risk factors via First Street. Map © Google.
Why this score? — see what drove the D- grade
The composite is a weighted blend of 9 inputs, each scored 0–100. Each bar is that input's sub-score; the figure is the points it added to the 100-point composite (weight × sub-score).
- ARV discount +12.1/15.0
- Cash flow +10.7/30.0
- Livability +3.3/5.0
- 1% rule +3.1/10.0
- DSCR +3.1/10.0
- Rent growth +2.7/5.0
- Condition / age +2.5/5.0
- Schools +2.4/10.0
- Appreciation +0.0/10.0
$217,000
🖨 Deal sheet 📄 Offer letter ✓ Due diligence
Listing remarks MLS
This beautiful 3-bedroom, 2-bath home offers 1,774 sq. ft. of comfortable living space designed for modern living. Featuring generous living areas and an open layout, the home flows effortlessly from room to room, creating an inviting space for both everyday living and entertaining. The kitchen is equipped with stainless steel appliances and sleek black granite countertops, offering both style and functionality. Tall, vaulted ceilings enhance the sense of space and natural light throughout the home, while two cozy fireplaces add warmth and character to the living areas. Enjoy the flexibility of two separate living areas, a dedicated dining room, and a well-appointed kitchen area that serves as the heart of the home. Step outside to a newly tiled back patio overlooking a spacious private backyard-perfect for relaxing, hosting, or creating your own outdoor retreat. Additional highlights include a brand-new roof with warranty, giving you peace of mind for years to come. This property delivers the space you need without sacrificing location or affordability-the perfect place to call home.
Key facts
- Two cozy fireplaces
- 7,666 sq ft lot
- 2 garage spots
Tags
Neighborhood map
What this means for you Summary
Snapshot
- This is a 3-bed/2.0-bath single-family listed at $217k.
Deal economics
- At list price, monthly cash flow is $-103 ($-1k/yr) — negative.
- To cash-flow at today's rent, offer at most $199k (8.3% below list).
- To meet the 1% rule (rent ≥ 1% of price), the offer needs to be $176k (18.8% below list).
- Recommended offer: $176k (18.8% below list) — sets the bar for 1% rule.
- Cap rate 5.7% vs local median 4.4% in Converse — meaningfully above typical; check what's discounted (condition, days-on-market, listing class) to confirm the premium yield is real.
Location & tenants
- Location reads 66/100 on livability (#649 in TX) — a middle-class / working-renter tenant base. Strengths: cost of living A+, housing A+, employment B; Watch: schools C-, crime C-, amenities F.
- Judson ISD (suburban): math 21% / reading 33% proficiency, ranked #660 of 826 in TX (top 80%) — low school quality limits family demand, transient renter base, plan for 1-2y turnover.
- Market conditions: Rents flat; 187 active listings in the ZIP; 40 comparable units currently listed for rent nearby; rentals at typical pace (median 24d on market — plan ~3-4 weeks tenant-placement turnaround); 8,308 units permitted in Bexar County in 2024 (2,506 in 5+ unit buildings).
Forward outlook
- Local home prices are declining (-3.0%/yr); year-one equity from $2k of loan paydown is wiped out by about $7k of value loss. Plan a longer hold.
- Bexar County population projected at +50% by 2050 — long-run rental-demand tailwind backs the buy-and-hold thesis.
Negotiation context
- It's been on market 69 days — a 6% lower offer ($204k) is reasonable based on typical stale-listing flexibility.
- 3 sale attempts since 9y ago with the ask held roughly flat each time — persistent listings suggest the price (not the market) is what's stuck; bring a comps-based counter.
Risks & watch-outs
- Climate carrying-cost: severe wind risk, 80% chance of damaging wind over 30y; extreme-heat days projected 7→22/yr by 2055 (HVAC capex compounding) — expect insurance premiums to compound above CPI over the hold.
Questions for the listing agent
- What do current leases actually rent for vs. the listed asking? Can we see a recent rent roll and the last 12 months of T-12 income?
- It's been on market 69 days. Have you received any prior offers? Is the seller open to a 19% concession, seller financing, or rate buy-down credit?
- Why hasn't it sold? Are there any deal-killer items the seller is aware of (foundation, flood, title, zoning, code violations)?
- Is there a deadline driving the sale (1031 exchange, divorce, estate, relocation)? That informs how much negotiation room exists.
- The area grade is low — what's the realistic commute time and amenity access for the typical tenant pool here? Any planned neighborhood developments (good or bad) we should know about?
- What's the average days-on-market for RENTAL listings here right now (not sales)? A rising rental-DOM trend means longer vacancies and softer asking-rent achievability than the comps imply.
- What's the recent tenant-quality profile in this submarket — average credit score on applications, eviction rate, late-payment / NSF rate, and stable-employment percentage? A property-management company in the area should have these aggregated.
- How much new for-sale + rental construction is in the pipeline within 1–3 miles? Heavy new supply typically softens prices + rents 12–24 months out; constrained supply supports both.
Investment metrics
- 1% rule
- 0.81% ✗
- Cap rate
- 5.73%
- Cash-on-cash
- -2.03%
- DSCR
- 0.91
- GRM
- 10.3
CMA / ARV
- ARV (median comp)
- $241,659
- List price
- $217,000
- Delta
- -10.20%
- Verdict
- UNDERPRICED
- Comps
- 20 within 1.0 mi
Show comp detail 12 sales within ~0.75 mi
| Address | Dist | Beds/Ba | Sqft | Sold | Price | $/sf | Match |
|---|---|---|---|---|---|---|---|
| 8032 Dove Trl | 0.09mi | 4/2.0 (+1) | 1,826 (+3%) | 2mo | $239,900 | $131 | 84 |
| 7138 Sunlit Trl | 0.33mi | 4/2.0 (+1) | 1,808 (+2%) | 0mo | $225,000 | $124 | 76 |
| 8178 Mescal Trl | 0.35mi | 3/2.0 | 1,895 (+7%) | 3mo | $199,999 | $106 | 70 |
| 7127 Elk Trl | 0.41mi | 3/2.0 | 1,884 (+6%) | 4mo | $257,500 | $137 | 68 |
| 7931 Pecan Hts | 0.58mi | 3/2.5 | 1,698 (-4%) | 1mo | $204,799 | $121 | 63 |
| 7309 Battle Basin | 0.41mi | 4/2.5 (+1) | 1,706 (-4%) | 6mo | $249,500 | $146 | 62 |
| 7906 Millers Trl | 0.71mi | 3/2.5 | 1,623 (-8%) | 2mo | $238,000 | $147 | 49 |
| 6670 Snow Meadow Dr | 0.63mi | 3/2.0 | 1,513 (-15%) | 2mo | $169,900 | $112 | 45 |
| 8343 Bent Mdw | 0.73mi | 3/2.0 | 1,952 (+10%) | 6mo | $219,999 | $113 | 44 |
| 6630 Snow Mdw | 0.72mi | 3/2.0 | 1,525 (-14%) | 0mo | $215,000 | $141 | 43 |
| 7935 Sonny Rdg | 0.68mi | 3/2.0 | 1,527 (-14%) | 3mo | $195,000 | $128 | 42 |
| 6534 Beech Trl | 0.72mi | 3/2.0 | 1,520 (-14%) | 4mo | $202,000 | $133 | 39 |
Match score weights: distance 35% · size 25% · config 20% · recency 20%. Top-matched comps best support the ARV.
Projected returns pro-forma
-3.0% appreciation · 0.75% rent growth · sell at horizon
- IRR
- -22.2%
- Equity multiple
- 0.25×
- Total profit
- $-45,573
- Equity at exit
- $32,355
- IRR
- -22.9%
- Equity multiple
- -0.04×
- Total profit
- $-63,302
- Equity at exit
- $18,762
Cash invested: $60,760 (down + closing). Projections, not guarantees.
Landlord ↔ Tenant lean methodology
- Overall (STATE)
- 87 Strongly Landlord-Friendly
- State Texas
- 87 Strongly Landlord-Friendly · R+5
- County
- — inherits STATE
- City
- — inherits STATE
ZIP-level market 78244
- Home prices YoY
- -4.4%
- Rents YoY
- 0.8%
- Active inventory
- 187
- Price-to-rent
- 10.3×
Monthly cashflow live
- Estimated rent
- $1,762 high interval (Pro) →
- Mortgage (P&I)
- −$1,138
- Tax from tax record
- −$266 /mo · $3,193/yr
- Insurance
- −$90
- HOA
- −$0
- Vacancy / Maint / Mgmt
- −$370
- Net cashflow
- $-103
Break-even live
UW: 25.0% down · 7.5% · 30yr · 1.5% tax · 5.0% vac · 8.0% maint · 8.0% mgmt
Financing live
Cash to close
- Down payment
- $54,250
- Closing costs
- $6,510
- Reserves months
- —
- Total cash needed
- —
Loan-product check · same deal, 3 products live
Conventional
25% down · 7.5% · 30yr
- Down + closing
- —
- Monthly P&I
- —
- Monthly cashflow
- —
- DSCR
- —
- Eligible?
- —
Personal DTI + credit; lowest rate.
DSCR
20% down · 8.5% · 30yr
- Down + closing
- —
- Monthly P&I
- —
- Monthly cashflow
- —
- DSCR
- —
- Eligible?
- —
No personal income docs; deal must DSCR.
Hard money
10% down · 12.0% · 12mo
- Down + closing
- —
- Monthly P&I
- —
- Monthly cashflow
- —
- DSCR
- —
- Eligible?
- —
Short-term bridge; refi at stabilization.
Rent comps 40 comps
| Address | Beds | Baths | Sqft | Rent | $/sqft | DOM | Units | Dist |
|---|---|---|---|---|---|---|---|---|
| 8005 Copper Trail Dr San Antonio, TX | 4.0 | 2.5 | 2319 | $1,600 | $0.69 | 24d | 1 | 0.03mi |
| 7011 Beech Trail Dr San Antonio, TX | 3.0 | 2.0 | 1704 | $4,500 | $2.64 | 2d | 1 | 0.08mi |
| 8043 Dove Trail Dr San Antonio, TX | 4.0 | 2.0 | 2319 | $1,800 | $0.78 | 14d | 1 | 0.09mi |
| 8039 Sunshine Trail Dr San Antonio, TX | 3.0 | 2.0 | 1774 | $1,745 | $0.98 | 4d | 1 | 0.14mi |
| 7135 Grassy Trl San Antonio, TX | 3.0 | 2.0 | 1422 | $2,000 | $1.41 | 43d | 1 | 0.22mi |
| 8111 Mescal Trl San Antonio, TX | 4.0 | 2.5 | 2521 | $1,899 | $0.75 | 43d | 1 | 0.23mi |
| 7114 Elm Trail Dr San Antonio, TX | 3.0 | 2.0 | 1332 | $1,600 | $1.20 | 43d | 1 | 0.33mi |
| 8008 Wayword Trl San Antonio, TX | 4.0 | 2.5 | 2010 | $1,895 | $0.94 | 4d | 1 | 0.34mi |
| 8162 Heights Vly Converse, TX | 4.0 | 2.5 | 1828 | $1,680 | $0.92 | 43d | 1 | 0.37mi |
| 7550 Ledgebrook Dr San Antonio, TX | 4.0 | 2.0 | 1782 | $1,650 | $0.93 | 24d | 1 | 0.37mi |
| 8251 Sunshine Trail Dr San Antonio, TX | 3.0 | 2.0 | 1627 | $1,695 | $1.04 | 24d | 1 | 0.38mi |
| 8210 Steep Vly Converse, TX | 3.0 | 2.5 | 1757 | $1,485 | $0.85 | 43d | 1 | 0.43mi |
| 8007 Chestnut Bluff Dr Converse, TX | 4.0 | 2.5 | 2145 | $1,825 | $0.85 | 14d | 1 | 0.43mi |
| 8304 Heights Vly Converse, TX | 3.0 | 2.0 | 1249 | $1,450 | $1.16 | 14d | 1 | 0.46mi |
| 7402 Anchors Peak San Antonio, TX | 4.0 | 2.5 | 2502 | $1,999 | $0.80 | 43d | 1 | 0.49mi |
| 8314 Steep Vly Converse, TX | 4.0 | 3.0 | 2316 | $1,625 | $0.70 | 24d | 1 | 0.49mi |
| 7507 Echo Trl San Antonio, TX | 3.0 | 2.0 | 1456 | $1,600 | $1.10 | 43d | 1 | 0.54mi |
| 7422 Branching Peak San Antonio, TX | 3.0 | 2.5 | 1605 | $1,669 | $1.04 | 2d | 1 | 0.57mi |
| 7919 Wayside Trl San Antonio, TX | 3.0 | 2.0 | 1453 | $1,400 | $0.96 | 43d | 1 | 0.57mi |
| 6461 Firestone Pkwy San Antonio, TX | 3.0 | 2.0 | 1778 | $1,695 | $0.95 | 43d | 1 | 0.58mi |
| 7407 Tom Kite Ct San Antonio, TX | 3.0 | 2.5 | 2415 | $2,095 | $0.87 | 4d | 1 | 0.59mi |
| 6106 Secret Shrs San Antonio, TX | 3.0 | 2.5 | 1698 | $1,500 | $0.88 | 24d | 1 | 0.59mi |
| 8203 Maple Meadow Dr Converse, TX | 4.0 | 2.5 | 2340 | $1,759 | $0.75 | 2d | 1 | 0.59mi |
| 7223 Archers Coach San Antonio, TX | 3.0 | 2.0 | 1370 | $1,485 | $1.08 | 3d | 1 | 0.60mi |
| 7807 Pecan Hts San Antonio, TX | 3.0 | 2.0 | 1520 | $1,600 | $1.05 | 14d | 1 | 0.60mi |
| 7500 Paradise Rd San Antonio, TX | 3.0 | 2.0 | 1650 | $1,950 | $1.18 | 43d | 1 | 0.61mi |
| 7323 Booker Bay San Antonio, TX | 3.0 | 2.0 | 1388 | $1,495 | $1.08 | 43d | 1 | 0.63mi |
| 6619 Meadow Fawn Dr Converse, TX | 4.0 | 2.5 | 2399 | $1,955 | $0.81 | 2d | 1 | 0.63mi |
| 6311 Encanto Point Dr San Antonio, TX | 3.0 | 2.5 | 2340 | $1,645 | $0.70 | 14d | 1 | 0.63mi |
| 6623 Meadow Dawn Dr Converse, TX | 3.0 | 2.0 | 1513 | $1,600 | $1.06 | 43d | 1 | 0.64mi |
| 7379 Longing Trl Unit 1 San Antonio, TX | 3.0 | 2.0 | 2432 | $1,350 | $0.56 | 12d | 1 | 0.64mi |
| 7422 Radford Trl San Antonio, TX | 4.0 | 2.0 | 1800 | $1,695 | $0.94 | 24d | 1 | 0.64mi |
| 7611 Overview Pl San Antonio, TX | 3.0 | 2.0 | 1451 | $1,750 | $1.21 | 14d | 1 | 0.64mi |
| 7510 Legend Rock San Antonio, TX | 3.0 | 2.0 | 2162 | $1,875 | $0.87 | 24d | 1 | 0.66mi |
| 7443 Longing Trl San Antonio, TX | 3.0 | 2.0 | 1487 | $1,495 | $1.01 | 12d | 1 | 0.72mi |
| 6718 Haven Meadow Dr Converse, TX | 4.0 | 2.5 | 2278 | $1,700 | $0.75 | 24d | 1 | 0.73mi |
| 8003 Chestnut Manor Dr Converse, TX | 3.0 | 2.0 | 1641 | $1,795 | $1.09 | 16d | 1 | 0.74mi |
| 8335 Bent Meadow Dr Converse, TX | 3.0 | 2.0 | 1513 | $1,595 | $1.05 | 43d | 1 | 0.74mi |
| 8011 Chestnut Barr Dr Converse, TX | 3.0 | 2.0 | 1520 | $1,665 | $1.10 | 43d | 1 | 0.74mi |
| 8015 Chestnut Barr Dr Converse, TX | 4.0 | 3.0 | 2300 | $1,849 | $0.80 | 3d | 1 | 0.75mi |
Listing history 21 events
-
2026-06-13statusdays on market $217,000 Pending 69 DOM
-
2026-06-09statusdays on market $217,000 Active Option 66 DOM
-
2026-06-08days on market $217,000 Active 65 DOM
-
2026-06-07days on market $217,000 Active 64 DOM
-
2026-06-04days on market $217,000 Active 61 DOM
-
2026-06-03days on market $217,000 Active 60 DOM
-
2026-06-02statusdays on market $217,000 Active 59 DOM
-
2026-06-01days on market $217,000 Back on Market 58 DOM
-
2026-05-31days on market $217,000 Back on Market 57 DOM
-
2026-05-06historical Active Option 1104-char remark
Show marketing remark (1104 chars)
This beautiful 3-bedroom, 2-bath home offers 1,774 sq. ft. of comfortable living space designed for modern living. Featuring generous living areas and an open layout, the home flows effortlessly from room to room, creating an inviting space for both everyday living and entertaining. The kitchen is equipped with stainless steel appliances and sleek black granite countertops, offering both style and functionality. Tall, vaulted ceilings enhance the sense of space and natural light throughout the home, while two cozy fireplaces add warmth and character to the living areas. Enjoy the flexibility of two separate living areas, a dedicated dining room, and a well-appointed kitchen area that serves as the heart of the home. Step outside to a newly tiled back patio overlooking a spacious private backyard-perfect for relaxing, hosting, or creating your own outdoor retreat. Additional highlights include a brand-new roof with warranty, giving you peace of mind for years to come. This property delivers the space you need without sacrificing location or affordability-the perfect place to call home.
-
2026-04-04$217,000 New 1104-char remark
Show marketing remark (1104 chars)
This beautiful 3-bedroom, 2-bath home offers 1,774 sq. ft. of comfortable living space designed for modern living. Featuring generous living areas and an open layout, the home flows effortlessly from room to room, creating an inviting space for both everyday living and entertaining. The kitchen is equipped with stainless steel appliances and sleek black granite countertops, offering both style and functionality. Tall, vaulted ceilings enhance the sense of space and natural light throughout the home, while two cozy fireplaces add warmth and character to the living areas. Enjoy the flexibility of two separate living areas, a dedicated dining room, and a well-appointed kitchen area that serves as the heart of the home. Step outside to a newly tiled back patio overlooking a spacious private backyard-perfect for relaxing, hosting, or creating your own outdoor retreat. Additional highlights include a brand-new roof with warranty, giving you peace of mind for years to come. This property delivers the space you need without sacrificing location or affordability-the perfect place to call home.
-
2017-09-19soldstatus
-
2017-09-12soldstatus Sold 163-char remark
Show marketing remark (163 chars)
Great 3 BR 2 BA 2 car garage cash investment property for rehab or rental. Sold As Is. Seller will not make repairs. ARV about $145K. Rental comps are $1200-$1350.
-
2017-08-29status Pending 163-char remark
Show marketing remark (163 chars)
Great 3 BR 2 BA 2 car garage cash investment property for rehab or rental. Sold As Is. Seller will not make repairs. ARV about $145K. Rental comps are $1200-$1350.
-
2017-08-22historical Active Option 163-char remark
Show marketing remark (163 chars)
Great 3 BR 2 BA 2 car garage cash investment property for rehab or rental. Sold As Is. Seller will not make repairs. ARV about $145K. Rental comps are $1200-$1350.
-
2017-08-17price $100,000 163-char remark
Show marketing remark (163 chars)
Great 3 BR 2 BA 2 car garage cash investment property for rehab or rental. Sold As Is. Seller will not make repairs. ARV about $145K. Rental comps are $1200-$1350.
-
2017-08-16status Price Change 163-char remark
Show marketing remark (163 chars)
Great 3 BR 2 BA 2 car garage cash investment property for rehab or rental. Sold As Is. Seller will not make repairs. ARV about $145K. Rental comps are $1200-$1350.
-
2017-08-14historical Active Option 163-char remark
Show marketing remark (163 chars)
Great 3 BR 2 BA 2 car garage cash investment property for rehab or rental. Sold As Is. Seller will not make repairs. ARV about $145K. Rental comps are $1200-$1350.
-
2017-08-10$110,000 New 163-char remark
Show marketing remark (163 chars)
Great 3 BR 2 BA 2 car garage cash investment property for rehab or rental. Sold As Is. Seller will not make repairs. ARV about $145K. Rental comps are $1200-$1350.
-
2003-06-30soldstatus
-
1997-11-10soldstatus
ⓘ Source: listings_history table (triggers on properties + properties_extension) + one-shot
backfill from property_details.listing_events for pre-trigger history.
Tax reassessment forecast TX · Resets to sale price
- Current annual tax
- $3,193 · $266/mo
- Projected year-2 tax
- $3,971 · $331/mo
- Expected delta
- +$778/yr (+$65/mo · 24.4%)
ⓘ Screening estimate from a state-policy table — verify with the county assessor before closing.
Climate risk First Street
- Flood 1/10 Low FEMA zone X (unshaded) · 0% chance over 30 yrs
- Wildfire 4/10 Moderate
- Heat 8/10 Severe 7 d/yr ≥108°F today · 22 d/yr by 30 yrs out
- Wind 8/10 Severe 80% chance of damaging wind over 30 yrs
- Air quality 1/10 Low 0 unhealthy d/yr today · 0 by 30 yrs out
Nearby sold comps map
Loading sold comps map…
Walkable amenities ~0.75 mi
Loading nearby amenities…
Taxation est. · year 1
- Rental income
- $21,143
- − Mortgage interest
- −$12,155
- − Property taxes
- −$3,193
- − Insurance
- −$1,085
- − Repairs & maintenance
- −$1,691
- − Management
- −$1,691
- − Depreciation
- −$6,313
- Taxable loss
- −$4,986
- Est. tax savings @ 24.0%
- +$1,197
- After-tax cash flow
- $-34/yr
For passive investors: Depreciation is non-cash, so a rental often shows a tax loss while cash-flowing — sheltering income. Rental losses are passive: they offset passive income freely, and up to $25,000/yr can offset ordinary (W-2) income if you actively participate and your MAGI is under $100k (phasing out to $0 by $150k); unused losses carry forward. On sale, claimed depreciation is recaptured at up to 25%, and gains may owe capital-gains tax (a 1031 exchange can defer both). Figures are a year-1 estimate at your 24.0% rate — not tax advice; consult a CPA.
Schools (NCES district)
- District
- Judson ISD
- NCES district ID
- 4824990
- Math proficiency
- 21% ▼ -21.00%
- Reading proficiency
- 33% ▼ -7.00%
- Median HH income
- $57,542
- Composite
- 24.39/100
- National rank
- #7689
- State rank
- #660 of 826 in TX
Livability — Converse
- Score
- 66/100
- State rank
- #649
- US rank
- #12250
Category grades
Schools grade is shown separately in the Schools card above.
Census & demographics
- County
- Bexar County · 1,990,555 people
- City population
- 63,067
- Metro
- San Antonio-New Braunfels, TX
- Population (ZIP)
- 38,092
- Household income
- $71,128
- Rent vs Own
- Severe rent burden
- 677.0
Population outlook (Bexar County) Hauer SSP2
- Today (2025)
- 2,336,851 people
- By 2030
- 2,560,728 · +9.6%
- By 2040
- 3,020,569 · +29.3%
- By 2050
- 3,493,522 · +49.5%
- By 2075
- 4,668,459 · +99.8%
- By 2100
- 5,533,242 · +136.8%
Race, ethnicity, and origin ACS 2023
- Neighborhood character
- Diverse neighborhood (Simpson 0.68)
- Race & ethnicity
- Hispanic / Latino 46% Black 27% Two or more races 24% White 20% Asian 2%
- Hispanic origin (detail)
- Mexican 38% Puerto Rican 2% Cuban 2%
- Common ancestry
- Slovak 2% Lithuanian 1% Italian 1%
- Foreign-born
- 14% · Canada, Vietnam
- Languages at home
- 68% English-only · Spanish 28% Vietnamese 1% Tagalog/Filipino 1%
Political lean MEDSL · Bexar
- 2024 margin
- Lean D (+9.8) · D 54.3% · R 44.6% · Other 1.1%
- 2008→2024 swing
- +4.2pp toward D · 2008: 5.6pp · 2024: 9.8pp
- All cycles
- 2024: D+9.8 2020: D+18.2 2016: D+13.5 2012: D+4.6 2008: D+5.6
Not yet ingested
- Civics
- —
Market trends
- HPI YoY
- ▼ -11.42%
- Current HPI
- 249.3834
- Rent YoY
- ▲ 0.75%
- Metro
- San Antonio-New Braunfels, TX
- State GDP YoY
- ▲ 3.95%
- F500 in state
- 110
Industry mix (Fortune 500 HQ in TX)
| Industry | F500 HQs | Revenue |
|---|---|---|
| Energy | 16 | $1,198B |
|
||
| Technology | 5 | $198B |
|
||
| Engineering / Construction | 4 | $72B |
|
||
| Energy Services | 3 | $60B |
|
||
| Utilities | 3 | $41B |
|
||
| Healthcare | 2 | $330B |
|
||
Price history
+97.3% since first listed12 events — show timeline
- 2026-05-06 Contingent — LERA
- 2026-04-04 Listed $217,000 LERA
- 2017-09-19 Sold (Public Records) — Public Records
- 2017-09-12 Sold (MLS) — LERA
- 2017-08-29 Pending — LERA
- 2017-08-22 Contingent — LERA
- 2017-08-17 Price Changed $100,000 LERA
- 2017-08-16 Relisted — LERA
- 2017-08-14 Contingent — LERA
- 2017-08-10 Listed $110,000 LERA
- 2003-06-30 Sold (Public Records) — Public Records
- 1997-11-10 Sold (Public Records) — Public Records
Property tax history
+11.0%/yrLatest (2025): $3,193 · -6.2% YoY. Source: county tax records.
Cash-flow waterfall
monthlySold comps — $/sqft
last 12 mo · ≤1 miLoading sold comps…