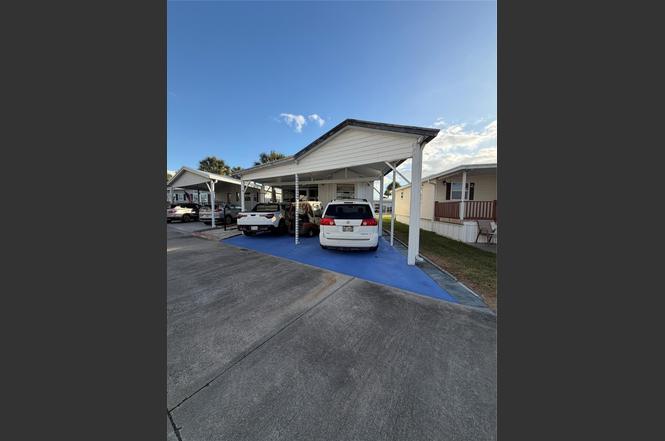
6444 SE 51st Ln
Taylor Creek, FL 34974
$99,000F
1 bd · 1.0 ba ·
496 sqft ·
Built 1993
· Manufactured
· Active
· 100 DOM
Cashflow @ list (25.0% down · 7.5%)
Estimated rent
$1,081/mo
Mortgage (P&I)
−$519
Tax + insurance
−$156
HOA
−$208
Vac / Maint / Mgmt
−$227
Net cashflow
$-29/mo
Annual
$-343/yr
Cap rate
5.95%
Cash-on-cash
-1.24%
DSCR
0.94
1% rule
1.09%
Cash to close
$27,720
Investor read
- This is a 1-bed/1.0-bath manufactured listed at $99k.
- At list price, monthly cash flow is $-29 ($-343/yr) — negative.
- To cash-flow at today's rent, offer at most $94k (5.1% below list).
- Meets the 1% rule at list price ($1k rent vs $99k).
- It's been on market 100 days — a 9% lower offer ($90k) is reasonable based on typical stale-listing flexibility.
- Recommended offer: $90k (9.0% below list) — sets the bar for market timing.
- Local home prices are declining (-3.0%/yr); year-one equity from $684 of loan paydown is wiped out by about $3k of value loss. Plan a longer hold.
- Location reads 56/100 on livability (#874 in FL) — a working-class tenant base; expect higher turnover. Strengths: cost of living A+, housing A+, crime B+; Watch: schools F, amenities F, commute F.
- Okeechobee (town): math 44% / reading 42% proficiency, ranked #58 of 73 in FL (top 80%) — families likely to look elsewhere, expect single-tenant / working-renter base with shorter leases; 72% free/reduced lunch — lower-income household profile, screen leases tightly.
- Market conditions: 402 active listings in the ZIP; 18 units permitted in Okeechobee County in 2024 (0 in 5+ unit buildings).
- Okeechobee County population projected at -21% by 2050 — secular population decline; favor cash flow + early exit over multi-decade hold.
- 3 sale attempts since 11y ago with the ask held roughly flat each time — persistent listings suggest the price (not the market) is what's stuck; bring a comps-based counter.
- Current owner paid $7k; list at $99k implies a 1356% gain — meaningful room to come down on a strong offer.
- Climate carrying-cost: severe wind risk, 99% chance of damaging wind over 30y; moderate wildfire risk; extreme-heat days projected 7→24/yr by 2055 (HVAC capex compounding) — expect insurance premiums to compound above CPI over the hold.
- Cap rate 5.9% vs local median 4.1% in Taylor Creek — top-decile yield for the area; either an underpriced asset or a hidden risk that comps aren't pricing in. Stress-test before assuming the spread holds.
Questions for listing agent
- What do current leases actually rent for vs. the listed asking? Can we see a recent rent roll and the last 12 months of T-12 income?
- It's been on market 100 days. Have you received any prior offers? Is the seller open to a 9% concession, seller financing, or rate buy-down credit?
- What does the HOA fee cover, when was the last increase, and are there any pending special assessments or reserve-fund shortfalls?
- Why hasn't it sold? Are there any deal-killer items the seller is aware of (foundation, flood, title, zoning, code violations)?
- Is there a deadline driving the sale (1031 exchange, divorce, estate, relocation)? That informs how much negotiation room exists.
- Schools are F-rated, which usually means shorter tenancies and higher turnover. Who's the typical renter profile here, and what's been the actual vacancy rate?
- The area grade is low — what's the realistic commute time and amenity access for the typical tenant pool here? Any planned neighborhood developments (good or bad) we should know about?
- What's the average days-on-market for RENTAL listings here right now (not sales)? A rising rental-DOM trend means longer vacancies and softer asking-rent achievability than the comps imply.
CashFlowRE · CFR-6WV01QFSKVTFJJ
· Data 1 day ago
cashflowre.app · 2026-05-29