6444 SE 51st Ln · Taylor Creek, FL
Flood risk 4/10 · Minor
- FEMA flood zone
- X (shaded)
- Chance of flooding over 30 yrs
- 0.23%
- Est. flood insurance / yr
- $507 – $1,088
Fire risk 5/10 · Moderate
- Est. fire insurance / yr
- $947 – $1,759
Heat risk 9/10 · Severe
- Hot days now (above 107°F)
- 7 days/yr
- Hot days in 30 yrs
- 24 days/yr
Wind risk 10/10 · Severe
- Chance of severe wind over 30 yrs
- 99.0%
Air-quality risk 2/10 · Minimal
- Unhealthy air days now
- 1 days/yr
- Unhealthy air days in 30 yrs
- 2 days/yr
Risk factors via First Street. Map © Google.
Why this score? — see what drove the F grade
The composite is a weighted blend of 9 inputs, each scored 0–100. Each bar is that input's sub-score; the figure is the points it added to the 100-point composite (weight × sub-score).
- Cash flow +11.7/30.0
- 1% rule +5.9/10.0
- Schools +3.6/10.0
- DSCR +3.4/10.0
- Livability +2.8/5.0
- Rent growth +2.5/5.0
- Condition / age +2.5/5.0
- ARV discount +0.0/15.0
- Appreciation +0.0/10.0
$99,000
🖨 Deal sheet 📄 Offer letter ✓ Due diligence
Listing remarks
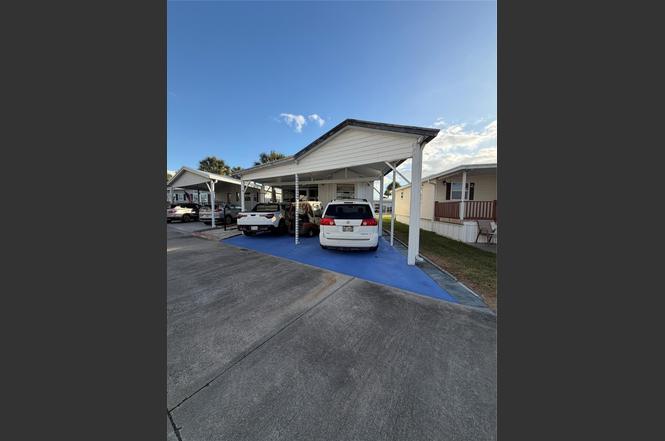
Welcome to resort-style 55+ living at Lake Okeechobee! This charming Palm Harbor park model with an addition offers 1 bed 1 bath, featuring Partially glass/Vinyl enclosed Florida room that adds extra comfort. The home comes completely furnished located on a double street and has a double carport for parking. Ancient Oaks is an active, resort style community offering a heated pool, pickleball courts, a huge clubhouse, and a full calendar of events. Enjoy the on-site marina with a boat ramp and fish cleaning station. Pets are welcome! Comfort, convenience, and an unbeatable lifestyle in one of Okeechobee's most sought after communities.
Key facts
- Pickleball courts
- Double carport
- Huge clubhouse
Tags
Property features AI
Finance
- HOA & community: Has association; Quarterly HOA fee; HOA includes grounds maintenance and trash; Community amenities: clubhouse, pool, other; Senior community
Exterior
- Parking: Attached garage; Attached carport; Covered parking (2 spaces); Carport with 2 spaces
- Utilities: Public water; Public sewer
- Home design: Mobile home; One story; First-floor entry; Faces east
- Construction: Metal roof; Resale condition
- Exterior features: Open porch; Glass-enclosed porch; Not waterfront
Interior
- Kitchen: Electric range; Gas range; Refrigerator; Kitchen island; Water purifier
- Bedrooms: 1 bedroom on the main level
- Flooring: Carpet; Laminate; Vinyl
- Bathrooms: 1 full bathroom
- Heating & cooling: Central heating; Central air conditioning
- Interior features: Furnished; Has fireplace
- Laundry & utility: Electric water heater; Water softener
Neighborhood map
What this means for you Summary
Snapshot
- This is a 1-bed/1.0-bath manufactured listed at $99k.
Deal economics
- At list price, monthly cash flow is $-29 ($-343/yr) — negative.
- To cash-flow at today's rent, offer at most $94k (5.1% below list).
- Meets the 1% rule at list price ($1k rent vs $99k).
- Recommended offer: $90k (9.0% below list) — sets the bar for market timing.
- Cap rate 5.9% vs local median 4.1% in Taylor Creek — top-decile yield for the area; either an underpriced asset or a hidden risk that comps aren't pricing in. Stress-test before assuming the spread holds.
Location & tenants
- Location reads 56/100 on livability (#874 in FL) — a working-class tenant base; expect higher turnover. Strengths: cost of living A+, housing A+, crime B+; Watch: schools F, amenities F, commute F.
- Okeechobee (town): math 44% / reading 42% proficiency, ranked #58 of 73 in FL (top 80%) — families likely to look elsewhere, expect single-tenant / working-renter base with shorter leases; 72% free/reduced lunch — lower-income household profile, screen leases tightly.
- Market conditions: 402 active listings in the ZIP; 18 units permitted in Okeechobee County in 2024 (0 in 5+ unit buildings).
Forward outlook
- Local home prices are declining (-3.0%/yr); year-one equity from $684 of loan paydown is wiped out by about $3k of value loss. Plan a longer hold.
- Okeechobee County population projected at -21% by 2050 — secular population decline; favor cash flow + early exit over multi-decade hold.
Negotiation context
- It's been on market 100 days — a 9% lower offer ($90k) is reasonable based on typical stale-listing flexibility.
- 3 sale attempts since 11y ago with the ask held roughly flat each time — persistent listings suggest the price (not the market) is what's stuck; bring a comps-based counter.
- Current owner paid $7k; list at $99k implies a 1356% gain — meaningful room to come down on a strong offer.
Risks & watch-outs
- Climate carrying-cost: severe wind risk, 99% chance of damaging wind over 30y; moderate wildfire risk; extreme-heat days projected 7→24/yr by 2055 (HVAC capex compounding) — expect insurance premiums to compound above CPI over the hold.
Questions for the listing agent
- What do current leases actually rent for vs. the listed asking? Can we see a recent rent roll and the last 12 months of T-12 income?
- It's been on market 100 days. Have you received any prior offers? Is the seller open to a 9% concession, seller financing, or rate buy-down credit?
- What does the HOA fee cover, when was the last increase, and are there any pending special assessments or reserve-fund shortfalls?
- Why hasn't it sold? Are there any deal-killer items the seller is aware of (foundation, flood, title, zoning, code violations)?
- Is there a deadline driving the sale (1031 exchange, divorce, estate, relocation)? That informs how much negotiation room exists.
- Schools are F-rated, which usually means shorter tenancies and higher turnover. Who's the typical renter profile here, and what's been the actual vacancy rate?
- The area grade is low — what's the realistic commute time and amenity access for the typical tenant pool here? Any planned neighborhood developments (good or bad) we should know about?
- What's the average days-on-market for RENTAL listings here right now (not sales)? A rising rental-DOM trend means longer vacancies and softer asking-rent achievability than the comps imply.
- What's the recent tenant-quality profile in this submarket — average credit score on applications, eviction rate, late-payment / NSF rate, and stable-employment percentage? A property-management company in the area should have these aggregated.
- How much new for-sale + rental construction is in the pipeline within 1–3 miles? Heavy new supply typically softens prices + rents 12–24 months out; constrained supply supports both.
Investment metrics
- 1% rule
- 1.09% ✓
- Cap rate
- 5.95%
- Cash-on-cash
- -1.24%
- DSCR
- 0.94
- GRM
- 7.6
CMA / ARV
- ARV (on-the-fly)
- $69,440
- Comps found
- 5
Show comp detail 5 sales within ~0.75 mi
| Address | Dist | Beds/Ba | Sqft | Sold | Price | $/sf | Match |
|---|---|---|---|---|---|---|---|
| 5312 SE 67th Ave | 0.21mi | 1/2.0 | 488 (-2%) | 5mo | $64,500 | $132 | 79 |
| 5354 SE 65th Ter | 0.18mi | 1/1.0 | 504 (+2%) | 17mo | $75,000 | $149 | 75 |
| 6649 SE 56th St | 0.30mi | 1/1.0 | 436 (-12%) | 1mo | $85,000 | $195 | 65 |
| 6458 SE 55th Ln | 0.28mi | 1/1.0 | 428 (-14%) | 8mo | $50,000 | $117 | 58 |
| 6531 SE 56th Ln | 0.31mi | 1/1.0 | 430 (-13%) | 11mo | $60,000 | $140 | 54 |
Match score weights: distance 35% · size 25% · config 20% · recency 20%. Top-matched comps best support the ARV.
Projected returns pro-forma
-3.0% appreciation · 3.0% rent growth · sell at horizon
- IRR
- -18.2%
- Equity multiple
- 0.36×
- Total profit
- $-17,723
- Equity at exit
- $14,761
- IRR
- -10.1%
- Equity multiple
- 0.38×
- Total profit
- $-17,213
- Equity at exit
- $8,560
Cash invested: $27,720 (down + closing). Projections, not guarantees.
Landlord ↔ Tenant lean methodology
- Overall (STATE)
- 87 Strongly Landlord-Friendly
- State Florida
- 87 Strongly Landlord-Friendly · R+3
- County
- — inherits STATE
- City
- — inherits STATE
ZIP-level market 34974
- Home prices YoY
- -15.6%
- Active inventory
- 402
- Price-to-rent
- 7.6×
Monthly cashflow live
- Estimated rent
- $1,081 medium interval (Pro) →
- Mortgage (P&I)
- −$519
- Tax from tax record
- −$114 /mo · $1,374/yr
- Insurance
- −$41
- HOA
- −$208
- Vacancy / Maint / Mgmt
- −$227
- Net cashflow
- $-29
Break-even live
UW: 25.0% down · 7.5% · 30yr · 1.5% tax · 5.0% vac · 8.0% maint · 8.0% mgmt
Financing live
Cash to close
- Down payment
- $24,750
- Closing costs
- $2,970
- Reserves months
- —
- Total cash needed
- —
Loan-product check · same deal, 3 products live
Conventional
25% down · 7.5% · 30yr
- Down + closing
- —
- Monthly P&I
- —
- Monthly cashflow
- —
- DSCR
- —
- Eligible?
- —
Personal DTI + credit; lowest rate.
DSCR
20% down · 8.5% · 30yr
- Down + closing
- —
- Monthly P&I
- —
- Monthly cashflow
- —
- DSCR
- —
- Eligible?
- —
No personal income docs; deal must DSCR.
Hard money
10% down · 12.0% · 12mo
- Down + closing
- —
- Monthly P&I
- —
- Monthly cashflow
- —
- DSCR
- —
- Eligible?
- —
Short-term bridge; refi at stabilization.
HOA detail
- Monthly dues
- $208 · $2,496/yr
- Likely covers
- pool
Listing history 24 events
-
2026-06-19days on market $99,000 Active 100 DOM
-
2026-06-18days on market $99,000 Active 99 DOM
-
2026-06-17days on market $99,000 Active 98 DOM
-
2026-06-16days on market $99,000 Active 97 DOM
-
2026-06-15days on market $99,000 Active 96 DOM
-
2026-06-14days on market $99,000 Active 94 DOM
-
2026-06-10days on market $99,000 Active 91 DOM
-
2026-06-09days on market $99,000 Active 90 DOM
-
2026-06-08days on market $99,000 Active 89 DOM
-
2026-06-07days on market $99,000 Active 88 DOM
-
2026-06-05days on market $99,000 Active 85 DOM
-
2026-06-03days on market $99,000 Active 84 DOM
-
2026-06-02days on market $99,000 Active 83 DOM
-
2026-06-01days on market $99,000 Active 82 DOM
-
2026-05-31days on market $99,000 Active 81 DOM
-
2026-05-30days on market $99,000 Active 80 DOM
-
2026-01-20$99,000 Active
-
2017-02-26historical
-
2016-03-07$59,999
-
2015-06-16historical
-
2015-03-06$58,900
-
1998-09-09soldstatus $6,800
-
1998-09-05soldstatus $6,800
-
1998-09-04soldstatus $6,800
ⓘ Source: listings_history table (triggers on properties + properties_extension) + one-shot
backfill from property_details.listing_events for pre-trigger history.
Tax reassessment forecast FL · Resets to sale price
- Current annual tax
- $1,374 · $114/mo
- Projected year-2 tax
- $1,374 · $114/mo
- Expected delta
- $0/yr ($0/mo · 0.0%)
ⓘ Screening estimate from a state-policy table — verify with the county assessor before closing.
Climate risk First Street
- Flood 4/10 Moderate FEMA zone X (shaded) · 23% chance over 30 yrs
- Wildfire 5/10 Major
- Heat 9/10 Extreme 7 d/yr ≥107°F today · 24 d/yr by 30 yrs out
- Wind 10/10 Extreme 99% chance of damaging wind over 30 yrs
- Air quality 2/10 Low 1 unhealthy d/yr today · 2 by 30 yrs out
Nearby sold comps map
Loading sold comps map…
Walkable amenities ~0.75 mi
Loading nearby amenities…
Taxation est. · year 1
- Rental income
- $12,977
- − Mortgage interest
- −$5,546
- − Property taxes
- −$1,374
- − Insurance
- −$495
- − Repairs & maintenance
- −$1,038
- − Management
- −$1,038
- − HOA
- −$2,496
- − Depreciation
- −$2,880
- Taxable loss
- −$1,889
- Est. tax savings @ 24.0%
- +$453
- After-tax cash flow
- $111/yr
For passive investors: Depreciation is non-cash, so a rental often shows a tax loss while cash-flowing — sheltering income. Rental losses are passive: they offset passive income freely, and up to $25,000/yr can offset ordinary (W-2) income if you actively participate and your MAGI is under $100k (phasing out to $0 by $150k); unused losses carry forward. On sale, claimed depreciation is recaptured at up to 25%, and gains may owe capital-gains tax (a 1031 exchange can defer both). Figures are a year-1 estimate at your 24.0% rate — not tax advice; consult a CPA.
Schools (NCES district)
- District
- Okeechobee
- NCES district ID
- 1201410
- Math proficiency
- 44% ▼ -12.00%
- Reading proficiency
- 42% ▼ -4.00%
- Median HH income
- $36,710
- Composite
- 35.73/100
- National rank
- #4855
- State rank
- #58 of 73 in FL
Livability — Taylor Creek
- Score
- 56/100
- State rank
- #874
- US rank
- #23017
Category grades
Schools grade is shown separately in the Schools card above.
Census & demographics
- County
- Okeechobee County · 23,975 people
- Metro
- Okeechobee, FL
- Population (ZIP)
- 23,975
- Household income
- $53,013
- Rent vs Own
- Severe rent burden
- 399.0
Population outlook (Okeechobee County) Hauer SSP2
- Today (2025)
- 37,273 people
- By 2030
- 35,885 · -3.7%
- By 2040
- 32,931 · -11.6%
- By 2050
- 29,433 · -21.0%
- By 2075
- 19,607 · -47.4%
- By 2100
- 11,814 · -68.3%
Race, ethnicity, and origin ACS 2023
- Neighborhood character
- Predominantly White (74%)
- Race & ethnicity
- White 74% Hispanic / Latino 19% Two or more races 8% Asian 2% Black 2% Native American 1%
- Hispanic origin (detail)
- Mexican 12% Puerto Rican 1% Cuban 2%
- Common ancestry
- Lithuanian 2% Iranian 2% Italian 2%
- Foreign-born
- 11% · Canada, Jamaica
- Languages at home
- 81% English-only · Spanish 16% French/Haitian/Cajun 1% Other Indo-European 1%
Political lean MEDSL · Okeechobee
- 2024 margin
- Solid R (+53.8) · D 22.9% · R 76.7%
- 2008→2024 swing
- -34.6pp toward R · 2008: -19.2pp · 2024: -53.8pp
- All cycles
- 2024: R+53.8 2020: R+44.4 2016: R+39.5 2012: R+20.0 2008: R+19.2
Not yet ingested
- Civics
- —
Market trends
- HPI YoY
- ▼ -64.47%
- Current HPI
- 348.6692
- Rent YoY
- —
- Metro
- Okeechobee, FL
- State GDP YoY
- ▲ 3.28%
- F500 in state
- 36
Industry mix (Fortune 500 HQ in FL)
| Industry | F500 HQs | Revenue |
|---|---|---|
| Industrial Technology | 2 | $29B |
|
||
| Insurance | 2 | $17B |
|
||
| Retail | 1 | $60B |
|
||
| Technology Distribution | 1 | $58B |
|
||
| Homebuilding | 1 | $35B |
|
||
| Technology Manufacturing | 1 | $35B |
|
||
Price history
+1355.9% since first listed8 events — show timeline
- 2026-01-20 Listed $99,000 Beaches MLS
- 2017-02-26 Listing Removed — Stellar MLS as Distributed by MLS Grid
- 2016-03-07 Listed $59,999 Stellar MLS as Distributed by MLS Grid
- 2015-06-16 Listing Removed — Stellar MLS as Distributed by MLS Grid
- 2015-03-06 Listed $58,900 Stellar MLS as Distributed by MLS Grid
- 1998-09-09 Sold (Public Records) $6,800 Public Records
- 1998-09-05 Sold (Public Records) $6,800 Public Records
- 1998-09-04 Sold (Public Records) $6,800 Public Records
Property tax history
+6.3%/yrLatest (2025): $1,374 · +147.1% YoY. Source: county tax records.
Cash-flow waterfall
monthlySold comps — $/sqft
last 12 mo · ≤1 miLoading sold comps…