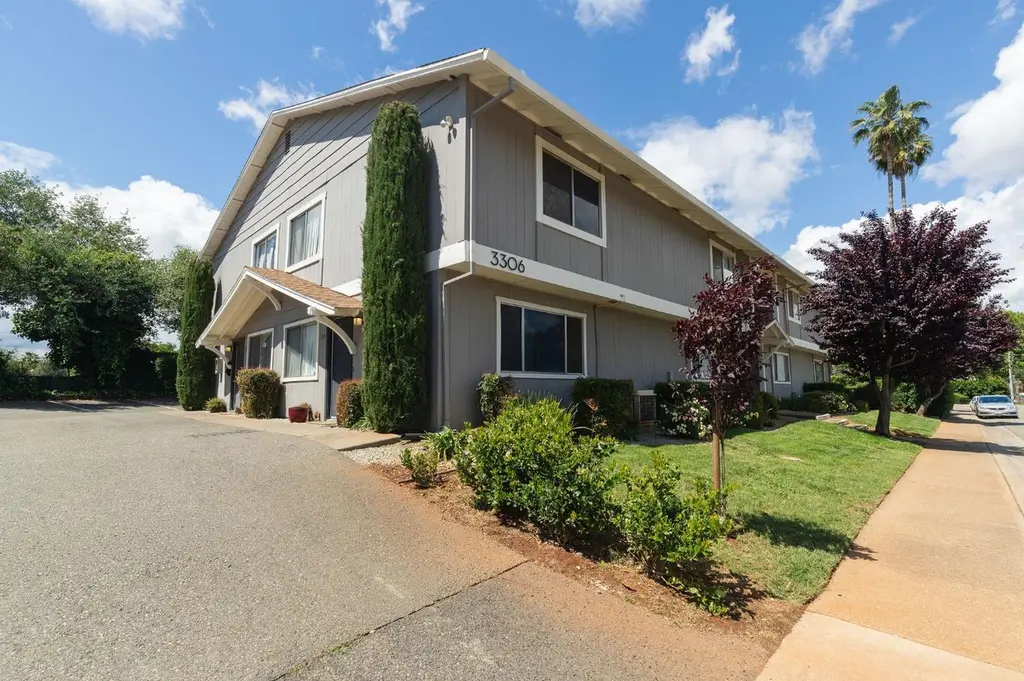
3260 - 3306 Alexander Dr
Redding, CA 96002
$3,250,000C+
48 bd · 14.4 ba ·
3,696 sqft ·
Built 1972
· MultiFamily
· Active
· 24 DOM
Cashflow @ list (25.0% down · 7.5%)
Estimated rent
$35,644/mo
Mortgage (P&I)
−$17,043
Tax + insurance
−$2,069
HOA
−$0
Vac / Maint / Mgmt
−$7,485
Net cashflow
$9,046/mo
Annual
$108,556/yr
Cap rate
9.63%
Cash-on-cash
11.93%
DSCR
1.53
1% rule
1.10%
Cash to close
$910,000
Investor read
- This is a 23×2bd/1ba + 1×2bd/1.5ba units multifamily listed at $3.25M.
- At list price, monthly cash flow is $9k ($109k/yr) — positive. Per door: $377/mo.
- The deal already cash-flows at list — no discount required.
- Meets the 1% rule at list price ($36k rent vs $3.25M).
- It's been on market 24 days — a 2% lower offer ($3.20M) is reasonable based on typical stale-listing flexibility.
- Recommended offer: $3.20M (1.5% below list) — sets the bar for market timing.
- Local home prices are declining (-3.0%/yr); year-one equity from $22k of loan paydown is wiped out by about $98k of value loss. Plan a longer hold.
- Location reads 76/100 on livability (#106 in CA, #3,726 nationally) — a middle-class / working-renter tenant base. Strengths: amenities A+, commute A+, health & safety A+; Watch: employment C-, crime F, cost of living F.
- Shasta Union High (urban): math 41% / reading 67% proficiency, ranked #122 of 517 in CA (top 24%) — acceptable for families but not a draw, mixed tenant base, ~2y average lease; only 16% free/reduced lunch — higher-income household profile.
- Market conditions: Rents rising (+1.9%/yr); 286 active listings in the ZIP; 246 units permitted in Shasta County in 2024 (0 in 5+ unit buildings).
- Shasta County population projected to shrink 9% by 2050 — rents likely to lag national; underwrite the cash flow, not the appreciation.
- Current owner paid $226k; list at $3.25M implies a 1338% gain — meaningful room to come down on a strong offer.
- Climate carrying-cost: extreme-heat days projected 7→16/yr by 2055 (HVAC capex compounding) — expect insurance premiums to compound above CPI over the hold.
- Cap rate 9.6% vs local median 3.3% in Redding — top-decile yield for the area; either an underpriced asset or a hidden risk that comps aren't pricing in. Stress-test before assuming the spread holds.
- At $35,644/mo this rent would consume 584% of the median local household income ($73k/yr) (locally 1026% of renters already pay >50% of income on rent) — very limited rent-growth headroom before tenants either downsize or default.
Questions for listing agent
- Can we see the unit-by-unit rent roll, current vacancy, and any below-market leases? What's the average tenancy length?
- What capital expenditures (roof, boiler, parking lot, exteriors) have been made in the last 5 years, and what's planned in the next 2?
- Built in 1972 — when were the roof, HVAC, electrical panel, plumbing, and water heater last replaced?
- Is there a deadline driving the sale (1031 exchange, divorce, estate, relocation)? That informs how much negotiation room exists.
- Schools are B-rated — typically a magnet for longer-tenancy family renters. What's the average tenant stay here, and is there a school-zone premium baked into asking?
- Crime grade is F in this area — have there been break-ins, vandalism, or insurance claims at this property in the last 3 years? What carrier currently insures it and at what premium?
- What's the average days-on-market for RENTAL listings here right now (not sales)? A rising rental-DOM trend means longer vacancies and softer asking-rent achievability than the comps imply.
- What's the recent tenant-quality profile in this submarket — average credit score on applications, eviction rate, late-payment / NSF rate, and stable-employment percentage? A property-management company in the area should have these aggregated.
CashFlowRE · CFR-6XMBF66CPHDBT8
· Data 1 day ago
cashflowre.app · 2026-05-29