 24-Plex
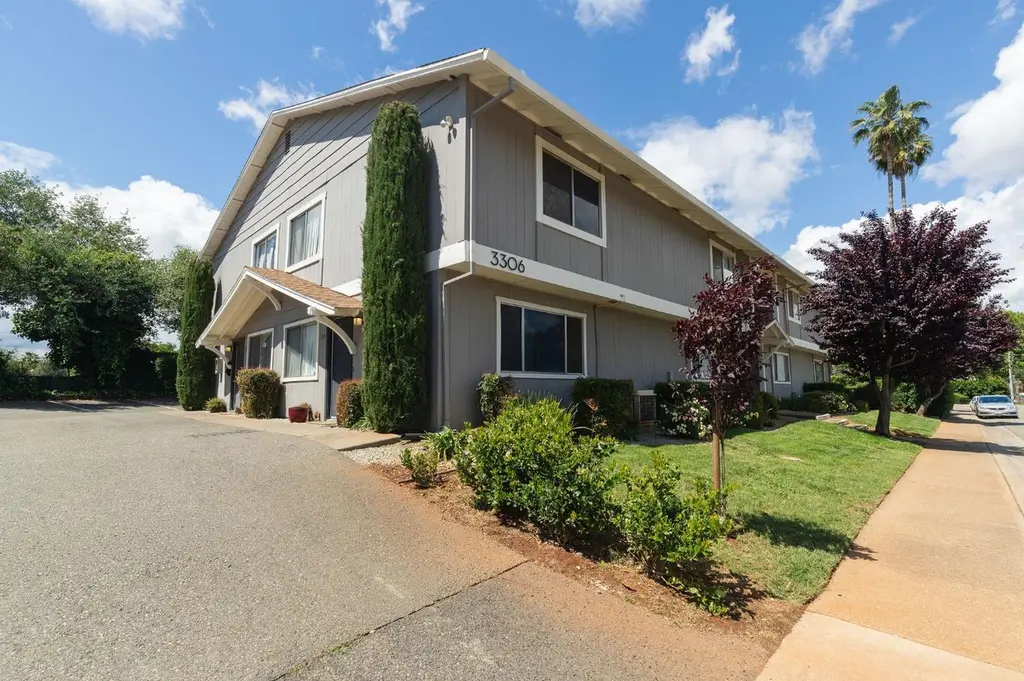
3260 - 3306 Alexander Dr · Redding, CA
Flood risk 1/10 · Minimal
- FEMA flood zone
- X (unshaded)
- Chance of flooding over 30 yrs
- 0.0%
- Est. flood insurance / yr
- $507 – $1,088
Fire risk 2/10 · Minimal
- Est. fire insurance / yr
- $659 – $1,223
Heat risk 8/10 · Major
- Hot days now (above 105°F)
- 7 days/yr
- Hot days in 30 yrs
- 16 days/yr
Wind risk 1/10 · Minimal
- Chance of severe wind over 30 yrs
- —
Air-quality risk 10/10 · Severe
- Unhealthy air days now
- 37 days/yr
- Unhealthy air days in 30 yrs
- 40 days/yr
Risk factors via First Street. Map © Google.
Why this score? — see what drove the C+ grade
The composite is a weighted blend of 9 inputs, each scored 0–100. Each bar is that input's sub-score; the figure is the points it added to the 100-point composite (weight × sub-score).
- Cash flow +26.9/30.0
- DSCR +9.3/10.0
- ARV discount +7.5/15.0
- 1% rule +6.0/10.0
- Schools +4.6/10.0
- Livability +3.8/5.0
- Rent growth +3.0/5.0
- Condition / age +2.5/5.0
- Appreciation +0.0/10.0
$3,250,000
🖨 Deal sheet 📄 Offer letter ✓ Due diligence
Multi-family units
County records classify this as Multi-Family (5+ Unit). Listing-text estimate: 24 units. confirmed
5+ unit building — per-unit beds/baths from public records are typically unavailable; the breakdown below (if shown) is an estimate from the listing text.
Listing remarks
Alexander Townhomes is a pride-of-ownership 24-unit multifamily community located at 3260 & 3306 Alexander Drive in Redding, California. Constructed in 1972, the property features an attractive unit mix of (23) two-bedroom / one-bath units and (1) three-bedroom / one-and-a-half-bath unit, each offering functional townhouse layouts. Each unit features vinyl plank flooring, updated lighting and electrical fixtures, and solid wood kitchen cabinetryfinishes that enhance overall consistency, maintainability, and pride of ownership throughout the property. Alexander Townhomes benefits from a highly desirable, family-oriented location adjacent to Rother Elementary School and within close pro
Key facts
- Updated lighting
- Vinyl plank flooring
- 1.07 acre lot
Tags
Property features AI
Finance
- Other: Property classified as residential income (apartments)
- Financial info: 24 total units
- HOA & community: No homeowners association
Exterior
- Parking: Parking details not provided
- Security: No specific security features listed
- Utilities: Natural gas connected; Public water (Water District/public); Public sewer; Irrigation tied to a public district
- Home design: Residential income property (apartments); Five-or-more unit apartment building; Built in 1972
- Construction: Building constructed in 1972
- Exterior features: Property sits on a cul-de-sac; Sidewalks present; Landscaped front yard
Interior
- Kitchen: Electric cooktop; Free-standing electric oven/range
- Bedrooms: Unit mix includes 2-bedroom and 3-bedroom apartments
- Flooring: Laminate flooring
- Bathrooms: Combination of full and partial bathrooms across units (units include full baths; at least one unit has an additional partial bath)
- Heating & cooling: Central heating; Central cooling; Gas water heater; Tankless water heater
- Interior features: Laminate flooring throughout common areas; Coin-operated laundry in a shared/common area; Washer and dryer units leased for on-site laundry; Two-story building
- Laundry & utility: Coin-operated laundry available in common area; Washer/dryer provided via lease
Neighborhood map
What this means for you Summary
Snapshot
- This is a 23×2bd/1ba + 1×2bd/1.5ba units multifamily listed at $3.25M.
Deal economics
- At list price, monthly cash flow is $9k ($109k/yr) — positive. Per door: $377/mo.
- The deal already cash-flows at list — no discount required.
- Meets the 1% rule at list price ($36k rent vs $3.25M).
- Recommended offer: $3.20M (1.5% below list) — sets the bar for market timing.
- Cap rate 9.6% vs local median 3.3% in Redding — top-decile yield for the area; either an underpriced asset or a hidden risk that comps aren't pricing in. Stress-test before assuming the spread holds.
Location & tenants
- Location reads 76/100 on livability (#106 in CA, #3,726 nationally) — a middle-class / working-renter tenant base. Strengths: amenities A+, commute A+, health & safety A+; Watch: employment C-, crime F, cost of living F.
- Shasta Union High (urban): math 41% / reading 67% proficiency, ranked #122 of 517 in CA (top 24%) — acceptable for families but not a draw, mixed tenant base, ~2y average lease; only 16% free/reduced lunch — higher-income household profile.
- Market conditions: Rents rising (+1.9%/yr); 286 active listings in the ZIP; 246 units permitted in Shasta County in 2024 (0 in 5+ unit buildings).
- At $35,644/mo this rent would consume 584% of the median local household income ($73k/yr) (locally 1026% of renters already pay >50% of income on rent) — very limited rent-growth headroom before tenants either downsize or default.
Forward outlook
- Local home prices are declining (-3.0%/yr); year-one equity from $22k of loan paydown is wiped out by about $98k of value loss. Plan a longer hold.
- Shasta County population projected to shrink 9% by 2050 — rents likely to lag national; underwrite the cash flow, not the appreciation.
Negotiation context
- It's been on market 24 days — a 2% lower offer ($3.20M) is reasonable based on typical stale-listing flexibility.
- Current owner paid $226k; list at $3.25M implies a 1338% gain — meaningful room to come down on a strong offer.
Risks & watch-outs
- Climate carrying-cost: extreme-heat days projected 7→16/yr by 2055 (HVAC capex compounding) — expect insurance premiums to compound above CPI over the hold.
Questions for the listing agent
- Can we see the unit-by-unit rent roll, current vacancy, and any below-market leases? What's the average tenancy length?
- What capital expenditures (roof, boiler, parking lot, exteriors) have been made in the last 5 years, and what's planned in the next 2?
- Built in 1972 — when were the roof, HVAC, electrical panel, plumbing, and water heater last replaced?
- Is there a deadline driving the sale (1031 exchange, divorce, estate, relocation)? That informs how much negotiation room exists.
- Schools are B-rated — typically a magnet for longer-tenancy family renters. What's the average tenant stay here, and is there a school-zone premium baked into asking?
- Crime grade is F in this area — have there been break-ins, vandalism, or insurance claims at this property in the last 3 years? What carrier currently insures it and at what premium?
- What's the average days-on-market for RENTAL listings here right now (not sales)? A rising rental-DOM trend means longer vacancies and softer asking-rent achievability than the comps imply.
- What's the recent tenant-quality profile in this submarket — average credit score on applications, eviction rate, late-payment / NSF rate, and stable-employment percentage? A property-management company in the area should have these aggregated.
- How much new apartment / multifamily construction is in the pipeline within 1–3 miles? Heavy new supply (>2% of stock underway) typically softens rents 12–24 months out; light construction supports rent growth.
Investment metrics
- 1% rule
- 1.10% ✓
- Cap rate
- 9.63%
- Cash-on-cash
- 11.93%
- DSCR
- 1.53
- GRM
- 7.6
CMA / ARV
No comps found within radius.
Projected returns pro-forma
-3.0% appreciation · 1.88% rent growth · sell at horizon
- IRR
- 0.2%
- Equity multiple
- 1.01×
- Total profit
- $8,277
- Equity at exit
- $484,586
- IRR
- 8.8%
- Equity multiple
- 1.64×
- Total profit
- $583,561
- Equity at exit
- $281,001
Cash invested: $910,000 (down + closing). Projections, not guarantees.
Landlord ↔ Tenant lean methodology
- Overall (STATE)
- 18 Strongly Tenant-Friendly
- State California
- 18 Strongly Tenant-Friendly · D+13
- County
- — inherits STATE
- City
- — inherits STATE
ZIP-level market 96002
- Rents YoY
- 1.9%
- Active inventory
- 286
- Price-to-rent
- 182.4×
Monthly cashflow live
- Estimated rent
- $35,644 high interval (Pro) →
- Mortgage (P&I)
- −$17,043
- Tax from tax record
- −$715 /mo · $8,579/yr
- Insurance
- −$1,354
- HOA
- −$0
- Vacancy / Maint / Mgmt
- −$7,485
- Net cashflow
- $9,046
Break-even live
24-unit breakdown (identical units grouped — click to expand)
| Units | Beds | Baths | Est. rent |
|---|---|---|---|
| 23× units | 2 | 1 | $34,155 |
| #1 | 2 | 1 | $1,485 |
| #2 | 2 | 1 | $1,485 |
| #3 | 2 | 1 | $1,485 |
| #4 | 2 | 1 | $1,485 |
| #5 | 2 | 1 | $1,485 |
| #6 | 2 | 1 | $1,485 |
| #7 | 2 | 1 | $1,485 |
| #8 | 2 | 1 | $1,485 |
| #9 | 2 | 1 | $1,485 |
| #10 | 2 | 1 | $1,485 |
| #11 | 2 | 1 | $1,485 |
| #12 | 2 | 1 | $1,485 |
| #13 | 2 | 1 | $1,485 |
| #14 | 2 | 1 | $1,485 |
| #15 | 2 | 1 | $1,485 |
| #16 | 2 | 1 | $1,485 |
| #17 | 2 | 1 | $1,485 |
| #18 | 2 | 1 | $1,485 |
| #19 | 2 | 1 | $1,485 |
| #20 | 2 | 1 | $1,485 |
| #21 | 2 | 1 | $1,485 |
| #22 | 2 | 1 | $1,485 |
| #23 | 2 | 1 | $1,485 |
| 1× unit | 2 | 1.5 | $1,485 |
| Total (24 units) | $35,644 | ||
UW: 25.0% down · 7.5% · 30yr · 1.5% tax · 5.0% vac · 8.0% maint · 8.0% mgmt
Financing live
Cash to close
- Down payment
- $812,500
- Closing costs
- $97,500
- Reserves months
- —
- Total cash needed
- —
Loan-product check · same deal, 3 products live
Conventional
25% down · 7.5% · 30yr
- Down + closing
- —
- Monthly P&I
- —
- Monthly cashflow
- —
- DSCR
- —
- Eligible?
- —
Personal DTI + credit; lowest rate.
DSCR
20% down · 8.5% · 30yr
- Down + closing
- —
- Monthly P&I
- —
- Monthly cashflow
- —
- DSCR
- —
- Eligible?
- —
No personal income docs; deal must DSCR.
Hard money
10% down · 12.0% · 12mo
- Down + closing
- —
- Monthly P&I
- —
- Monthly cashflow
- —
- DSCR
- —
- Eligible?
- —
Short-term bridge; refi at stabilization.
Listing history 21 events
-
2026-06-19days on market $3,250,000 Active 24 DOM
-
2026-06-18days on market $3,250,000 Active 23 DOM
-
2026-06-17days on market $3,250,000 Active 22 DOM
-
2026-06-16days on market $3,250,000 Active 21 DOM
-
2026-06-15days on market $3,250,000 Active 20 DOM
-
2026-06-14days on market $3,250,000 Active 18 DOM
-
2026-06-13days on market $3,250,000 Active 17 DOM
-
2026-06-10days on market $3,250,000 Active 15 DOM
-
2026-06-09days on market $3,250,000 Active 14 DOM
-
2026-06-08days on market $3,250,000 Active 13 DOM
-
2026-06-07days on market $3,250,000 Active 12 DOM
-
2026-06-05days on market $3,250,000 Active 9 DOM
-
2026-06-03days on market $3,250,000 Active 8 DOM
-
2026-06-02days on market $3,250,000 Active 7 DOM
-
2026-06-01days on market $3,250,000 Active 6 DOM
-
2026-05-31days on market $3,250,000 Active 5 DOM
-
2026-05-30days on market $3,250,000 Active 4 DOM
-
2025-06-25soldstatus $226,000
-
2025-03-19soldstatus $226,000
-
1999-03-31soldstatus $425,000
-
1989-02-28soldstatus $655,000
ⓘ Source: listings_history table (triggers on properties + properties_extension) + one-shot
backfill from property_details.listing_events for pre-trigger history.
Tax reassessment forecast CA · Resets to sale price
- Current annual tax
- $8,579 · $715/mo
- Projected year-2 tax
- $24,700 · $2,058/mo
- Expected delta
- +$16,121/yr (+$1,343/mo · 187.9%)
ⓘ Screening estimate from a state-policy table — verify with the county assessor before closing.
Climate risk First Street
- Flood 1/10 Low FEMA zone X (unshaded) · 0% chance over 30 yrs
- Wildfire 2/10 Low
- Heat 8/10 Severe 7 d/yr ≥105°F today · 16 d/yr by 30 yrs out
- Wind 1/10 Low
- Air quality 10/10 Extreme 37 unhealthy d/yr today · 40 by 30 yrs out
Nearby sold comps map
Loading sold comps map…
Walkable amenities ~0.75 mi
Loading nearby amenities…
Taxation est. · year 1
- Rental income
- $427,728
- − Mortgage interest
- −$182,051
- − Property taxes
- −$8,579
- − Insurance
- −$16,250
- − Repairs & maintenance
- −$34,218
- − Management
- −$34,218
- − Depreciation
- −$94,545
- Taxable income
- $57,866
- Est. tax owed @ 24.0%
- −$13,888
- After-tax cash flow
- $94,668/yr
For passive investors: Depreciation is non-cash, so a rental often shows a tax loss while cash-flowing — sheltering income. Rental losses are passive: they offset passive income freely, and up to $25,000/yr can offset ordinary (W-2) income if you actively participate and your MAGI is under $100k (phasing out to $0 by $150k); unused losses carry forward. On sale, claimed depreciation is recaptured at up to 25%, and gains may owe capital-gains tax (a 1031 exchange can defer both). Figures are a year-1 estimate at your 24.0% rate — not tax advice; consult a CPA.
Schools (NCES district)
- District
- Shasta Union High
- NCES district ID
- 0636600
- Math proficiency
- 41% ▲ 3.00%
- Reading proficiency
- 67% ▲ 9.00%
- Median HH income
- $50,080
- Composite
- 46.01/100
- National rank
- #2532
- State rank
- #122 of 517 in CA
Livability — Redding
- Score
- 76/100
- State rank
- #106
- US rank
- #3726
Category grades
Schools grade is shown separately in the Schools card above.
Census & demographics
- Census place
- Redding, CA
- County
- Shasta County · 147,641 people
- City population
- 112,523
- Metro
- Redding, CA
- Population (ZIP)
- 33,783
- Household income
- $73,222
- Rent vs Own
- Severe rent burden
- 1026.0
Population outlook (Shasta County) Hauer SSP2
- Today (2025)
- 179,231 people
- By 2030
- 176,953 · -1.3%
- By 2040
- 169,982 · -5.2%
- By 2050
- 162,547 · -9.3%
- By 2075
- 145,649 · -18.7%
- By 2100
- 123,025 · -31.4%
Race, ethnicity, and origin ACS 2023
- Neighborhood character
- Predominantly White (72%)
- Race & ethnicity
- White 72% Hispanic / Latino 13% Two or more races 12% Asian 6% Native American 2% Black 1%
- Hispanic origin (detail)
- Mexican 10%
- Common ancestry
- Italian 4% Lithuanian 2% Slovak 2%
- Foreign-born
- 5% · Canada
- Languages at home
- 91% English-only · Spanish 4% Other Asian/Pacific 2% Other Indo-European 1%
Political lean MEDSL · Shasta
- 2024 margin
- Solid R (+36.5) · D 30.5% · R 67.0% · Other 2.5%
- 2008→2024 swing
- -10.7pp toward R · 2008: -25.8pp · 2024: -36.5pp
- All cycles
- 2024: R+36.5 2020: R+33.1 2016: R+37.4 2012: R+30.3 2008: R+25.8
Not yet ingested
- Civics
- —
Market trends
- HPI YoY
- ▼ -248.70%
- Current HPI
- 319.713
- Rent YoY
- ▲ 1.88%
- Metro
- Redding, CA
- State GDP YoY
- ▲ 3.21%
- F500 in state
- 116
Industry mix (Fortune 500 HQ in CA)
| Industry | F500 HQs | Revenue |
|---|---|---|
| Technology | 27 | $1,492B |
|
||
| Financial Services | 3 | $174B |
|
||
| Retail | 3 | $44B |
|
||
| Insurance | 3 | $26B |
|
||
| Media / Entertainment | 2 | $115B |
|
||
| Pharmaceuticals / Biotech | 2 | $62B |
|
||
Price history
-65.5% since first listed4 events — show timeline
- 2025-06-25 Sold (Public Records) $226,000 Public Records
- 2025-03-19 Sold (Public Records) $226,000 Public Records
- 1999-03-31 Sold (Public Records) $425,000 Public Records
- 1989-02-28 Sold (Public Records) $655,000 Public Records
Property tax history
+9.3%/yrLatest (2025): $8,579 · +73.0% YoY. Source: county tax records.
Cash-flow waterfall
monthlySold comps — $/sqft
last 12 mo · ≤1 miLoading sold comps…