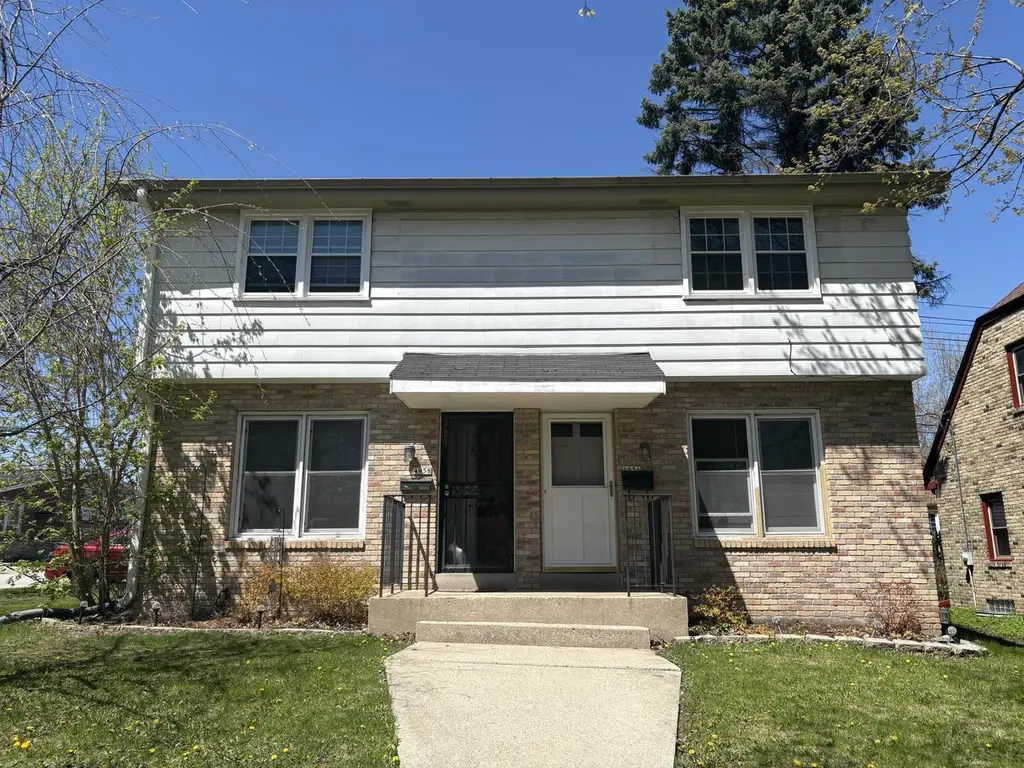
4956 W Midland Dr #4958
Greenfield, WI 53219
$290,000C+
6 bd · 3.0 ba ·
2,244 sqft ·
Built 1965
· MultiFamily
· Pending
· 1 DOM
Cashflow @ list (25.0% down · 7.5%)
Estimated rent
$3,123/mo
Mortgage (P&I)
−$1,521
Tax + insurance
−$483
HOA
−$0
Vac / Maint / Mgmt
−$656
Net cashflow
$463/mo
Annual
$5,557/yr
Cap rate
8.21%
Cash-on-cash
6.84%
DSCR
1.30
1% rule
1.08%
Cash to close
$81,200
Investor read
- This is a 2 × 3-bed/1.5-bath units multifamily listed at $290k.
- At list price, monthly cash flow is $463 ($6k/yr) — positive. Per door: $232/mo.
- The deal already cash-flows at list — no discount required.
- Meets the 1% rule at list price ($3k rent vs $290k).
- Only 1 days on market — expect competitive offers; lowballing is unlikely to land.
- Local home prices are declining (-3.0%/yr); year-one equity from $2k of loan paydown is wiped out by about $9k of value loss. Plan a longer hold.
- Location reads 86/100 on livability (#23 in WI, #361 nationally) — a professional / high-income tenant draw. Strengths: commute A+, cost of living A+, housing A+.
- Greenfield School District (suburban): math 27% / reading 34% proficiency, ranked #271 of 342 in WI (top 79%) — families likely to look elsewhere, expect single-tenant / working-renter base with shorter leases.
- Zoned schools: Greenfield High (math 17% / reading 29%, grade F, #343 of 483 statewide, top 72%, 1,157 students, 47% FRL) — zoned schools average 47% FRL vs 32% district-wide (15 pts higher); higher-poverty schools than district average — tighter screening recommended.
- Market conditions: Rents rising fast (+5.1%/yr); 55 active listings in the ZIP; 1,017 units permitted in Milwaukee County in 2024 (803 in 5+ unit buildings).
- Milwaukee County population projected at +4% by 2050 — modest demand growth; plan on rents tracking national, not racing it.
- 3 sale attempts since 14y ago with the ask held roughly flat each time — persistent listings suggest the price (not the market) is what's stuck; bring a comps-based counter.
- Current owner paid $175k; list at $290k implies a 66% gain — meaningful room to come down on a strong offer.
- Cap rate 8.2% vs local median 2.8% in Greenfield — top-decile yield for the area; either an underpriced asset or a hidden risk that comps aren't pricing in. Stress-test before assuming the spread holds.
- At $3,123/mo this rent would consume 53% of the median local household income ($70k/yr) (locally 902% of renters already pay >50% of income on rent) — very limited rent-growth headroom before tenants either downsize or default.
Questions for listing agent
- Can we see the unit-by-unit rent roll, current vacancy, and any below-market leases? What's the average tenancy length?
- What capital expenditures (roof, boiler, parking lot, exteriors) have been made in the last 5 years, and what's planned in the next 2?
- Built in 1965 — when were the roof, HVAC, electrical panel, plumbing, and water heater last replaced?
- Is there a deadline driving the sale (1031 exchange, divorce, estate, relocation)? That informs how much negotiation room exists.
- What's the average days-on-market for RENTAL listings here right now (not sales)? A rising rental-DOM trend means longer vacancies and softer asking-rent achievability than the comps imply.
- What's the recent tenant-quality profile in this submarket — average credit score on applications, eviction rate, late-payment / NSF rate, and stable-employment percentage? A property-management company in the area should have these aggregated.
- How much new apartment / multifamily construction is in the pipeline within 1–3 miles? Heavy new supply (>2% of stock underway) typically softens rents 12–24 months out; light construction supports rent growth.
CashFlowRE · CFR-71DA0C5R6VFWQN
· Data 3 weeks ago
cashflowre.app · 2026-05-29