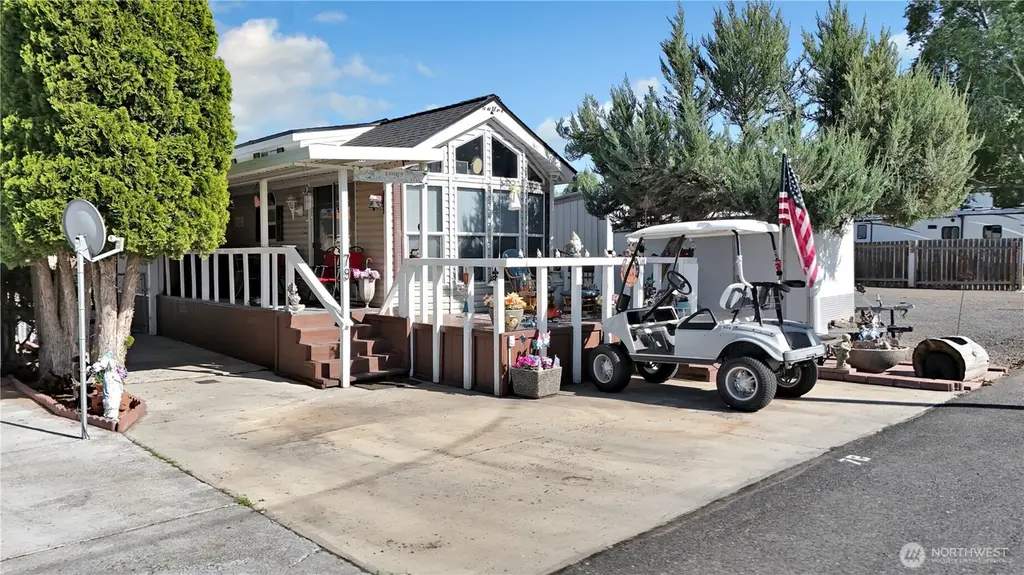
7037 E HWY 262 #79
Marine View, WA 99344
$150,000D-
1 bd · 1.0 ba ·
396 sqft ·
Built 2004
· Condo
· Active
· 49 DOM
Cashflow @ list (25.0% down · 7.5%)
Estimated rent
$1,235/mo
Mortgage (P&I)
−$787
Tax + insurance
−$191
HOA
−$46
Vac / Maint / Mgmt
−$259
Net cashflow
$-48/mo
Annual
$-572/yr
Cap rate
5.91%
Cash-on-cash
-1.36%
DSCR
0.94
1% rule
0.82%
Cash to close
$42,000
Investor read
- This is a 1-bed/1.0-bath condo listed at $150k.
- At list price, monthly cash flow is $-48 ($-572/yr) — negative.
- To cash-flow at today's rent, offer at most $142k (5.6% below list).
- To meet the 1% rule (rent ≥ 1% of price), the offer needs to be $124k (17.7% below list).
- It's been on market 49 days — a 3% lower offer ($146k) is reasonable based on typical stale-listing flexibility.
- Recommended offer: $124k (17.7% below list) — sets the bar for 1% rule.
- Local home prices are declining (-3.0%/yr); year-one equity from $1k of loan paydown is wiped out by about $4k of value loss. Plan a longer hold.
- Location reads: area grade D — affects rentability + tenant quality, not the cash-flow math above.
- Royal School District (rural): math 34% / reading 40% proficiency, ranked #241 of 291 in WA (top 83%) — families likely to look elsewhere, expect single-tenant / working-renter base with shorter leases; 82% free/reduced lunch — lower-income household profile, screen leases tightly.
- Zoned schools: Red Rock Elementary (526 students, 80% FRL); Royal Intermediate School (404 students, 80% FRL); Royal High School (550 students, 82% FRL) — zoned schools at 81% FRL track the district average.
- Market conditions: 87 active listings in the ZIP; 559 units permitted in Grant County in 2024 (35 in 5+ unit buildings).
- Grant County population projected at +16% by 2050 — long-run rental-demand tailwind backs the buy-and-hold thesis.
- Current owner paid $11k; list at $150k implies a 1264% gain — meaningful room to come down on a strong offer.
- Climate carrying-cost: major wildfire risk — expect insurance premiums to compound above CPI over the hold.
Questions for listing agent
- What do current leases actually rent for vs. the listed asking? Can we see a recent rent roll and the last 12 months of T-12 income?
- It's been on market 49 days. Have you received any prior offers? Is the seller open to a 18% concession, seller financing, or rate buy-down credit?
- What does the HOA fee cover, when was the last increase, and are there any pending special assessments or reserve-fund shortfalls?
- Any open or pending special assessments — roof, HVAC, plumbing, elevator, façade? What's the per-unit balance and payoff schedule, and is the seller paying it off at close or rolling it to the buyer?
- Is there a deadline driving the sale (1031 exchange, divorce, estate, relocation)? That informs how much negotiation room exists.
- The area grade is low — what's the realistic commute time and amenity access for the typical tenant pool here? Any planned neighborhood developments (good or bad) we should know about?
- What's the average days-on-market for RENTAL listings here right now (not sales)? A rising rental-DOM trend means longer vacancies and softer asking-rent achievability than the comps imply.
- What's the recent tenant-quality profile in this submarket — average credit score on applications, eviction rate, late-payment / NSF rate, and stable-employment percentage? A property-management company in the area should have these aggregated.
CashFlowRE · CFR-72XKSVDQWA9X19
· Data 4 h ago
cashflowre.app · 2026-05-29