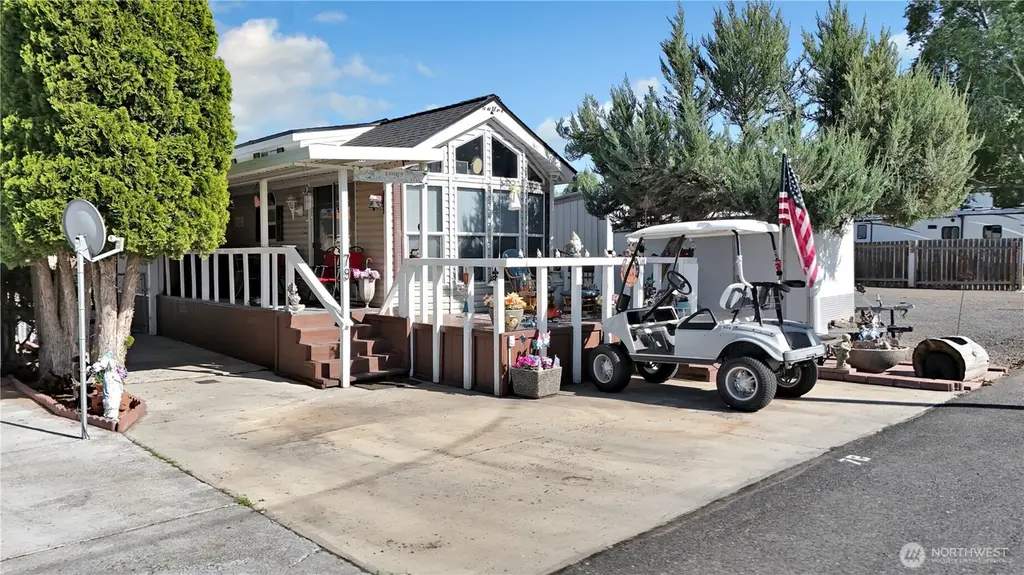
7037 E HWY 262 #79 · Marine View, WA
Flood risk 1/10 · Minimal
- FEMA flood zone
- X (unshaded)
- Chance of flooding over 30 yrs
- 0.0%
- Est. flood insurance / yr
- $507 – $1,088
Fire risk 7/10 · Major
- Est. fire insurance / yr
- $604 – $1,122
Heat risk 4/10 · Minor
- Hot days now (above 97°F)
- 6 days/yr
- Hot days in 30 yrs
- 13 days/yr
Wind risk 1/10 · Minimal
- Chance of severe wind over 30 yrs
- —
Air-quality risk 8/10 · Major
- Unhealthy air days now
- 16 days/yr
- Unhealthy air days in 30 yrs
- 17 days/yr
Risk factors via First Street. Map © Google.
Why this score? — see what drove the D- grade
The composite is a weighted blend of 9 inputs, each scored 0–100. Each bar is that input's sub-score; the figure is the points it added to the 100-point composite (weight × sub-score).
- Cash flow +11.6/30.0
- ARV discount +7.5/15.0
- DSCR +3.4/10.0
- Schools +3.4/10.0
- 1% rule +3.2/10.0
- Rent growth +2.5/5.0
- Livability +2.5/5.0
- Condition / age +2.5/5.0
- Appreciation +0.0/10.0
$150,000
🖨 Deal sheet (PDF) 📄 Offer letter ✓ Due diligence
Listing remarks
Golf course views • Near Potholes Reservoir • Boat parking + low-maintenance lot! 1 bed + den, 1 bath, 2004 park model home with 492 sq ft, located in a manufactured home and RV park near Potholes Reservoir. Positioned with views of Legacy Resort at Frenchman Hills Golf Course, offering proximity to golf, boating, and fishing recreation. Interior layout includes 1 bedroom plus an upper level den for additional sleeping space, office, or storage. Efficient floor plan with engineered hardwood flooring in the main living area designed for low-maintenance living or seasonal use. Exterior features asphalt and concrete throughout for minimal upkeep, partial fencing, boat parking, a stor
Key facts
- Boat parking
- Low-maintenance lot
- Partial fencing
Tags
Property features AI
Finance
- Other: Lot: approximately 70' x 29' (lot number 79)
- Financial info: Listing terms: Cash, Conventional; Land is leased
- HOA & community: Has HOA with annual fee of $550 covering common area maintenance, sewer, trash and water; Gated community
Exterior
- Parking: Driveway parking
- Security: Partially fenced; Security gate
- Utilities: Electric energy source; Community water; Sewer connected; Power provided by Grant County PUD
- Home design: Manufactured single wide home; One story; Main level entry; Faces west; Potholes Golf & Camping Condo Phase 1 community (land is leased)
- Construction: Built in 2004 (effective year); Wood construction; Composition roof; Block foundation
- Exterior features: Partially fenced lot; Outbuildings; Paved lot; Wood exterior/wood products; Has view; Level topography
Interior
- Kitchen: Refrigerator; Stove/Range; Dishwasher not listed
- Bedrooms: 1 bedroom (main level)
- Flooring: Engineered hardwood; Laminate; Carpet
- Bathrooms: 1 full bathroom with bathtub and shower
- Heating & cooling: Heat pump heating; Central air and heat pump cooling
- Interior features: Appliances included: Dryer, Washer, Refrigerator, Stove/Range; Engineered hardwood, laminate and carpet flooring; No basement
- Laundry & utility: Washer and dryer included
Neighborhood map
What this means for you Summary
Snapshot
- This is a 1-bed/1.0-bath condo listed at $150k.
Deal economics
- At list price, monthly cash flow is $-48 ($-572/yr) — negative.
- To cash-flow at today's rent, offer at most $142k (5.6% below list).
- To meet the 1% rule (rent ≥ 1% of price), the offer needs to be $124k (17.7% below list).
- Recommended offer: $124k (17.7% below list) — sets the bar for 1% rule.
Location & tenants
- Location reads: area grade D — affects rentability + tenant quality, not the cash-flow math above.
- Royal School District (rural): math 34% / reading 40% proficiency, ranked #241 of 291 in WA (top 83%) — families likely to look elsewhere, expect single-tenant / working-renter base with shorter leases; 82% free/reduced lunch — lower-income household profile, screen leases tightly.
- Zoned schools: Red Rock Elementary (526 students, 80% FRL); Royal Intermediate School (404 students, 80% FRL); Royal High School (550 students, 82% FRL) — zoned schools at 81% FRL track the district average.
- Market conditions: 87 active listings in the ZIP; 559 units permitted in Grant County in 2024 (35 in 5+ unit buildings).
Forward outlook
- Local home prices are declining (-3.0%/yr); year-one equity from $1k of loan paydown is wiped out by about $4k of value loss. Plan a longer hold.
- Grant County population projected at +16% by 2050 — long-run rental-demand tailwind backs the buy-and-hold thesis.
Negotiation context
- It's been on market 49 days — a 3% lower offer ($146k) is reasonable based on typical stale-listing flexibility.
- Current owner paid $11k; list at $150k implies a 1264% gain — meaningful room to come down on a strong offer.
Risks & watch-outs
- Climate carrying-cost: major wildfire risk — expect insurance premiums to compound above CPI over the hold.
Questions for the listing agent
- What do current leases actually rent for vs. the listed asking? Can we see a recent rent roll and the last 12 months of T-12 income?
- It's been on market 49 days. Have you received any prior offers? Is the seller open to a 18% concession, seller financing, or rate buy-down credit?
- What does the HOA fee cover, when was the last increase, and are there any pending special assessments or reserve-fund shortfalls?
- Any open or pending special assessments — roof, HVAC, plumbing, elevator, façade? What's the per-unit balance and payoff schedule, and is the seller paying it off at close or rolling it to the buyer?
- Is there a deadline driving the sale (1031 exchange, divorce, estate, relocation)? That informs how much negotiation room exists.
- The area grade is low — what's the realistic commute time and amenity access for the typical tenant pool here? Any planned neighborhood developments (good or bad) we should know about?
- What's the average days-on-market for RENTAL listings here right now (not sales)? A rising rental-DOM trend means longer vacancies and softer asking-rent achievability than the comps imply.
- What's the recent tenant-quality profile in this submarket — average credit score on applications, eviction rate, late-payment / NSF rate, and stable-employment percentage? A property-management company in the area should have these aggregated.
- How much new apartment / multifamily construction is in the pipeline within 1–3 miles? Heavy new supply (>2% of stock underway) typically softens rents 12–24 months out; light construction supports rent growth.
Investment metrics
- 1% rule
- 0.82% ✗
- Cap rate
- 5.91%
- Cash-on-cash
- -1.36%
- DSCR
- 0.94
- GRM
- 10.1
CMA / ARV
No comps found within radius.
Projected returns pro-forma
-3.0% appreciation · 3.0% rent growth · sell at horizon
- IRR
- -18.5%
- Equity multiple
- 0.35×
- Total profit
- $-27,331
- Equity at exit
- $22,365
- IRR
- -10.9%
- Equity multiple
- 0.34×
- Total profit
- $-27,664
- Equity at exit
- $12,969
Cash invested: $42,000 (down + closing). Projections, not guarantees.
Landlord ↔ Tenant lean methodology
- Overall (STATE)
- 28 Tenant-Leaning
- State Washington
- 28 Tenant-Leaning · D+8
- County
- — inherits STATE
- City
- — inherits STATE
ZIP-level market 99344
- Active inventory
- 87
- Price-to-rent
- 10.1×
Monthly cashflow live
- Estimated rent
- $1,235 medium interval (Pro) →
- Mortgage (P&I)
- −$787
- Tax from tax record
- −$128 /mo · $1,540/yr
- Insurance
- −$62
- HOA
- −$46
- Vacancy / Maint / Mgmt
- −$259
- Net cashflow
- $-48
Break-even live
Sensitivity live
| Price | -10% $37 | -5% $-5 | +0% $-48 | +5% $-90 | +10% $-133 |
|---|---|---|---|---|---|
| Rent | -10% $-145 | -5% $-96 | +0% $-48 | +5% $1 | +10% $50 |
| Rate | -1.0pp $28 | -0.5pp $-9 | base $-48 | +0.5pp $-87 | +1.0pp $-126 |
UW: 25.0% down · 7.5% · 30yr · 1.5% tax · 5.0% vac · 8.0% maint · 8.0% mgmt
Financing live
Cash to close
- Down payment
- $37,500
- Closing costs
- $4,500
- Reserves months
- —
- Total cash needed
- —
Loan-product check · same deal, 3 products live
Conventional
25% down · 7.5% · 30yr
- Down + closing
- —
- Monthly P&I
- —
- Monthly cashflow
- —
- DSCR
- —
- Eligible?
- —
Personal DTI + credit; lowest rate.
DSCR
20% down · 8.5% · 30yr
- Down + closing
- —
- Monthly P&I
- —
- Monthly cashflow
- —
- DSCR
- —
- Eligible?
- —
No personal income docs; deal must DSCR.
Hard money
10% down · 12.0% · 12mo
- Down + closing
- —
- Monthly P&I
- —
- Monthly cashflow
- —
- DSCR
- —
- Eligible?
- —
Short-term bridge; refi at stabilization.
HOA detail condo
- Monthly dues
- $46 · $552/yr
- Assessments
- None detected in remarks — confirm with the listing agent.
Listing history 23 events
-
2026-06-22days on market $150,000 Active 49 DOM
-
2026-06-21days on market $150,000 Active 48 DOM
-
2026-06-19days on market $150,000 Active 46 DOM
-
2026-06-18days on market $150,000 Active 45 DOM
-
2026-06-17days on market $150,000 Active 44 DOM
-
2026-06-16days on market $150,000 Active 43 DOM
-
2026-06-15days on market $150,000 Active 42 DOM
-
2026-06-14days on market $150,000 Active 40 DOM
-
2026-06-13days on market $150,000 Active 39 DOM
-
2026-06-10days on market $150,000 Active 37 DOM
-
2026-06-09days on market $150,000 Active 36 DOM
-
2026-06-08days on market $150,000 Active 35 DOM
-
2026-06-07days on market $150,000 Active 34 DOM
-
2026-06-03days on market $150,000 Active 30 DOM
-
2026-06-02days on market $150,000 Active 29 DOM
-
2026-06-01days on market $150,000 Active 28 DOM
-
2026-05-31days on market $150,000 Active 27 DOM
-
2026-05-30days on market $150,000 Active 26 DOM
-
2026-05-04$150,000 Active
-
2002-08-13soldstatus $11,000
-
2002-08-13soldstatus $14,999
-
2002-01-08soldstatus $275,000
-
1997-03-06soldstatus $168,628
ⓘ Source: listings_history table (triggers on properties + properties_extension) + one-shot
backfill from property_details.listing_events for pre-trigger history.
Tax reassessment forecast WA · Resets to sale price
- Current annual tax
- $1,540 · $128/mo
- Projected year-2 tax
- $1,540 · $128/mo
- Expected delta
- $0/yr ($0/mo · 0.0%)
ⓘ Screening estimate from a state-policy table — verify with the county assessor before closing.
Climate risk First Street
- Flood 1/10 Low FEMA zone X (unshaded) · 0% chance over 30 yrs
- Wildfire 7/10 Severe
- Heat 4/10 Moderate 6 d/yr ≥97°F today · 13 d/yr by 30 yrs out
- Wind 1/10 Low
- Air quality 8/10 Severe 16 unhealthy d/yr today · 17 by 30 yrs out
Nearby sold comps map
Loading sold comps map…
Walkable amenities ~0.75 mi
Loading nearby amenities…
Taxation est. · year 1
- Rental income
- $14,822
- − Mortgage interest
- −$8,402
- − Property taxes
- −$1,540
- − Insurance
- −$750
- − Repairs & maintenance
- −$1,186
- − Management
- −$1,186
- − HOA
- −$552
- − Depreciation
- −$4,364
- Taxable loss
- −$3,157
- Est. tax savings @ 24.0%
- +$758
- After-tax cash flow
- $186/yr
For passive investors: Depreciation is non-cash, so a rental often shows a tax loss while cash-flowing — sheltering income. Rental losses are passive: they offset passive income freely, and up to $25,000/yr can offset ordinary (W-2) income if you actively participate and your MAGI is under $100k (phasing out to $0 by $150k); unused losses carry forward. On sale, claimed depreciation is recaptured at up to 25%, and gains may owe capital-gains tax (a 1031 exchange can defer both). Figures are a year-1 estimate at your 24.0% rate — not tax advice; consult a CPA.
Schools (NCES district)
- District
- Royal School District
- NCES district ID
- 5307620
- Math proficiency
- 34% ▬ 0.00%
- Reading proficiency
- 40% ▼ -1.00%
- Median HH income
- $42,923
- Composite
- 33.87/100
- National rank
- #10366
- State rank
- #241 of 291 in WA
Livability — Marine View
No livability data for this city. (Only ~50 U.S. cities are tracked.)
Census & demographics
- Census place
- Marine View, WA
- Population (ZIP)
- 19,458
Population outlook (Grant County) Hauer SSP2
- Today (2025)
- 99,356 people
- By 2030
- 102,107 · +2.8%
- By 2040
- 108,318 · +9.0%
- By 2050
- 114,712 · +15.5%
- By 2075
- 131,376 · +32.2%
- By 2100
- 146,163 · +47.1%
Race, ethnicity, and origin ACS 2023
- Neighborhood character
- Predominantly Hispanic (73%)
- Race & ethnicity
- Hispanic / Latino 73% White 25% Two or more races 21% Native American 3%
- Hispanic origin (detail)
- Mexican 68%
- Common ancestry
- Portuguese 2% Lithuanian 1% Italian 1%
- Foreign-born
- 27% · Canada
- Languages at home
- 40% English-only · Spanish 59%
Political lean MEDSL · Grant
- 2024 margin
- Solid R (+37.5) · D 30.0% · R 67.4% · Other 2.6%
- 2008→2024 swing
- -9.9pp toward R · 2008: -27.5pp · 2024: -37.5pp
- All cycles
- 2024: R+37.5 2020: R+34.4 2016: R+37.9 2012: R+32.6 2008: R+27.5
Not yet ingested
- Civics
- —
Market trends
- HPI YoY
- ▼ -401.63%
- Current HPI
- 212.6444
- Rent YoY
- —
- Metro
- —
- State GDP YoY
- ▲ 4.65%
- F500 in state
- 22
Industry mix (Fortune 500 HQ in WA)
| Industry | F500 HQs | Revenue |
|---|---|---|
| Retail | 2 | $269B |
|
||
| Technology / Retail | 1 | $638B |
|
||
| Technology | 1 | $245B |
|
||
| Telecommunications | 1 | $38B |
|
||
| Food / Beverage | 1 | $36B |
|
||
| Automotive / Trucks | 1 | $34B |
|
||
Price history
-11.0% since first listed5 events — show timeline
- 2026-05-04 Listed $150,000 NWMLS as Distributed by MLS Grid
- 2002-08-13 Sold (Public Records) $14,999 Public Records
- 2002-08-13 Sold (Public Records) $11,000 Public Records
- 2002-01-08 Sold (Public Records) $275,000 Public Records
- 1997-03-06 Sold (Public Records) $168,628 Public Records
Property tax history
+5.2%/yrLatest (2026): $1,540 · +0.0% YoY. Source: county tax records.
Cash-flow waterfall
monthlySold comps — $/sqft
last 12 mo · ≤1 miLoading sold comps…