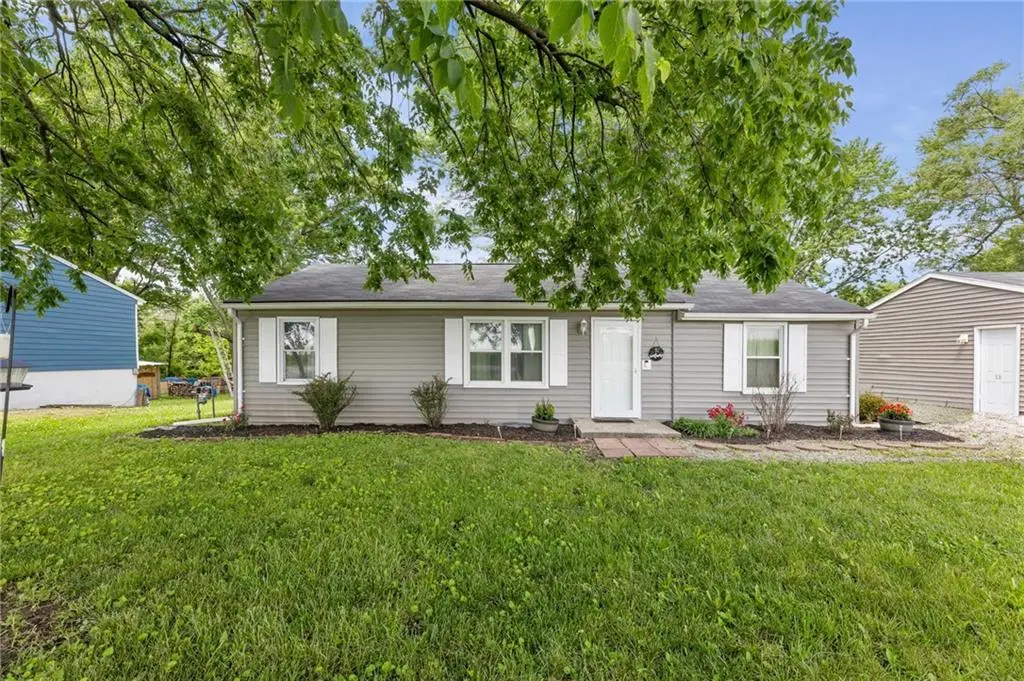
18710 S Mullen Dr
Belton, MO 64012
$239,900D
3 bd · 2.0 ba ·
1,008 sqft ·
Built 1955
· SingleFamily
· Pending
· 3 DOM
Cashflow @ list (25.0% down · 7.5%)
Estimated rent
$2,160/mo
Mortgage (P&I)
−$1,258
Tax + insurance
−$186
HOA
−$0
Vac / Maint / Mgmt
−$454
Net cashflow
$263/mo
Annual
$3,152/yr
Cap rate
7.61%
Cash-on-cash
4.69%
DSCR
1.21
1% rule
0.90%
Cash to close
$67,172
Investor read
- This is a 3-bed/2.0-bath single-family listed at $240k.
- At list price, monthly cash flow is $263 ($3k/yr) — positive.
- The deal already cash-flows at list — no discount required.
- To meet the 1% rule (rent ≥ 1% of price), the offer needs to be $216k (10.0% below list).
- Only 3 days on market — expect competitive offers; lowballing is unlikely to land.
- Recommended offer: $216k (10.0% below list) — sets the bar for 1% rule.
- Local home prices are declining (-3.0%/yr); year-one equity from $2k of loan paydown is wiped out by about $7k of value loss. Plan a longer hold.
- Location reads 76/100 on livability (#52 in MO, #3,782 nationally) — a middle-class / working-renter tenant base. Strengths: cost of living A+, housing A+, health & safety A+; Watch: crime C-, commute F.
- Belton 124 (suburban): math 28% / reading 39% proficiency, ranked #216 of 324 in MO (top 67%) — families likely to look elsewhere, expect single-tenant / working-renter base with shorter leases.
- Zoned schools: Cambridge Elem. (math 22% / reading 27%, grade F, #879 of 1,115 statewide, top 81%, 423 students, 56% FRL); Belton High (math 27% / reading 59%, grade F, #211 of 521 statewide, top 41%, 1,374 students, 42% FRL) — zoned schools at 49% FRL track the district average.
- Watch-outs: built in 1955 — expect roof / HVAC / electrical / plumbing capex.
- Market conditions: Rents rising fast (+5.2%/yr); 204 active listings in the ZIP; 2 comparable units currently listed for rent nearby; 588 units permitted in Cass County in 2024 (0 in 5+ unit buildings).
- Cass County population projected to shrink 3% by 2050 — rents likely to lag national; underwrite the cash flow, not the appreciation.
- 10 sale attempts since 14y ago with the ask held roughly flat each time — persistent listings suggest the price (not the market) is what's stuck; bring a comps-based counter.
- Cap rate 7.6% vs local median 4.7% in Belton — top-decile yield for the area; either an underpriced asset or a hidden risk that comps aren't pricing in. Stress-test before assuming the spread holds.
- This rent runs 36% of the median local income ($72k/yr) — at the standard rent-burdened threshold; future hikes will face affordability resistance.
Questions for listing agent
- Built in 1955 — when were the roof, HVAC, electrical panel, plumbing, and water heater last replaced?
- Is there a deadline driving the sale (1031 exchange, divorce, estate, relocation)? That informs how much negotiation room exists.
- Schools are D-rated, which usually means shorter tenancies and higher turnover. Who's the typical renter profile here, and what's been the actual vacancy rate?
- The area grade is low — what's the realistic commute time and amenity access for the typical tenant pool here? Any planned neighborhood developments (good or bad) we should know about?
- What's the average days-on-market for RENTAL listings here right now (not sales)? A rising rental-DOM trend means longer vacancies and softer asking-rent achievability than the comps imply.
- What's the recent tenant-quality profile in this submarket — average credit score on applications, eviction rate, late-payment / NSF rate, and stable-employment percentage? A property-management company in the area should have these aggregated.
- How much new for-sale + rental construction is in the pipeline within 1–3 miles? Heavy new supply typically softens prices + rents 12–24 months out; constrained supply supports both.
CashFlowRE · CFR-730YA548CAXD82
· Data 1 week ago
cashflowre.app · 2026-05-29