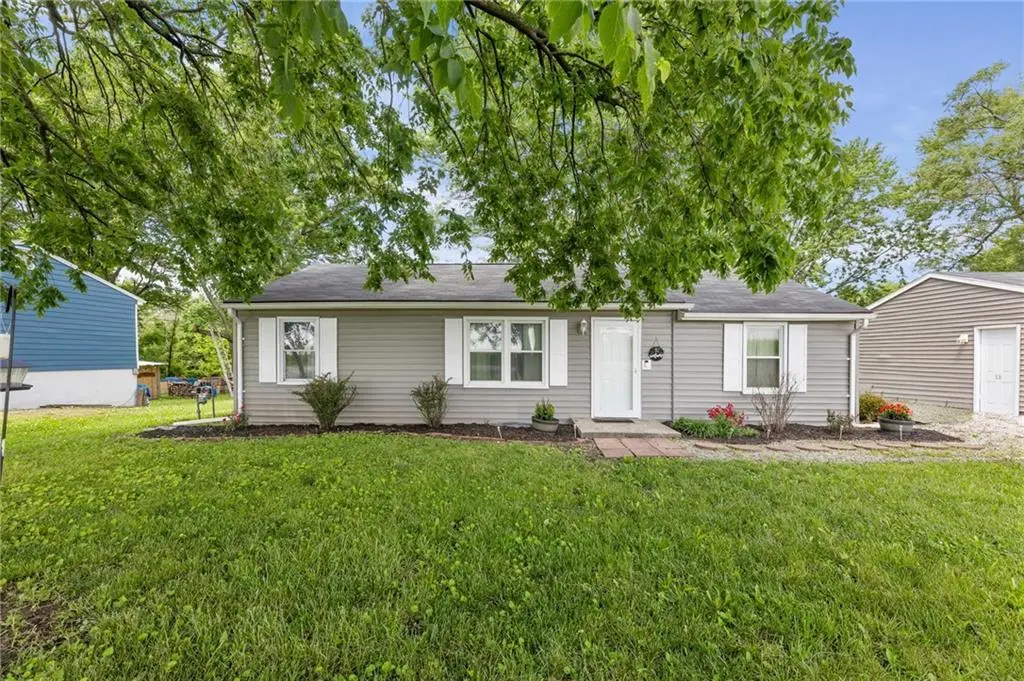
18710 S Mullen Dr · Belton, MO
Flood risk 1/10 · Minimal
- FEMA flood zone
- X (unshaded)
- Chance of flooding over 30 yrs
- 0.0%
- Est. flood insurance / yr
- $507 – $1,088
Fire risk 2/10 · Minimal
- Est. fire insurance / yr
- $1,054 – $1,958
Heat risk 4/10 · Minor
- Hot days now (above 107°F)
- 7 days/yr
- Hot days in 30 yrs
- 17 days/yr
Wind risk 2/10 · Minimal
- Chance of severe wind over 30 yrs
- 1.0%
Air-quality risk 2/10 · Minimal
- Unhealthy air days now
- 2 days/yr
- Unhealthy air days in 30 yrs
- 2 days/yr
Risk factors via First Street. Map © Google.
Why this score? — see what drove the D grade
The composite is a weighted blend of 9 inputs, each scored 0–100. Each bar is that input's sub-score; the figure is the points it added to the 100-point composite (weight × sub-score).
- Cash flow +19.3/30.0
- DSCR +6.1/10.0
- 1% rule +4.0/10.0
- Rent growth +3.8/5.0
- Livability +3.8/5.0
- Schools +3.0/10.0
- Condition / age +2.5/5.0
- ARV discount +0.0/15.0
- Appreciation +0.0/10.0
$239,900
🖨 Deal sheet 📄 Offer letter ✓ Due diligence
Listing remarks MLS
* * * BACK ON THE MARKET AT NO FAULT OF THE SELLERS * * * Experience Rural Elegance on the edge of town! Your dream home awaits in this REMODELED ranch-style home, nestled on a sprawling . 71 acre lot. 2 CAR DETACHED GARAGE featuring a BONUS ROOM tailor made for a workshop or extra storage. Revamped kitchen with BRAND NEW stainless steel appliances and granite countertops. Step onto all-new flooring that complements the freshly applied interior & exterior paint. Bath has been completely redone to give it a fresh clean look. The vast outdoor oasis invites you to create your own paradise. Picture a flourishing garden, a charming chicken coop, or a welcoming fire pit for entertaining under the starlit sky. Located just minutes away from a plethora of shopping and dining options. Seize this opportunity - DON'T MISS OUT on making this exquisite property your own!
Key facts
- Expansive lot
- Remodeled ranch home
- Well-lit bonus room
Tags
Property features AI
Finance
- Other: City lot on paved road; Lot size about 0.71 acres
- HOA & community: Association fees billed annually
Exterior
- Parking: Detached garage facing front; 2-car garage
- Security: Smoke detector(s)
- Utilities: Public water; Private sewer (lagoon); High-speed internet available
- Home design: Single-family residence; Ranch floor plan; Residential property
- Construction: Vinyl siding; Composition roof; Crawl space foundation; Approximately 51–75 years old
- Exterior features: Deck; Outbuilding
Interior
- Kitchen: Dishwasher; Disposal; Refrigerator; Gas range; Stainless steel appliances; Laminate counters
- Bedrooms: 3 bedrooms, all on the first floor
- Flooring: Carpet in several rooms
- Bathrooms: 2 full bathrooms
- Heating & cooling: Forced air heating; Electric cooling
- Interior features: Ceiling fan(s); Main floor primary bedroom; Main floor bedrooms; Mud room; Workshop; Eat-in kitchen
- Laundry & utility: Laundry room located off the kitchen
Neighborhood map
What this means for you Summary
Snapshot
- This is a 3-bed/2.0-bath single-family listed at $240k.
Deal economics
- At list price, monthly cash flow is $263 ($3k/yr) — positive.
- The deal already cash-flows at list — no discount required.
- To meet the 1% rule (rent ≥ 1% of price), the offer needs to be $216k (10.0% below list).
- Recommended offer: $216k (10.0% below list) — sets the bar for 1% rule.
- Cap rate 7.6% vs local median 4.7% in Belton — top-decile yield for the area; either an underpriced asset or a hidden risk that comps aren't pricing in. Stress-test before assuming the spread holds.
Location & tenants
- Location reads 76/100 on livability (#52 in MO, #3,782 nationally) — a middle-class / working-renter tenant base. Strengths: cost of living A+, housing A+, health & safety A+; Watch: crime C-, commute F.
- Belton 124 (suburban): math 28% / reading 39% proficiency, ranked #216 of 324 in MO (top 67%) — families likely to look elsewhere, expect single-tenant / working-renter base with shorter leases.
- Zoned schools: Cambridge Elem. (math 22% / reading 27%, grade F, #879 of 1,115 statewide, top 81%, 423 students, 56% FRL); Belton High (math 27% / reading 59%, grade F, #211 of 521 statewide, top 41%, 1,374 students, 42% FRL) — zoned schools at 49% FRL track the district average.
- Market conditions: Rents rising fast (+5.2%/yr); 204 active listings in the ZIP; 2 comparable units currently listed for rent nearby; 588 units permitted in Cass County in 2024 (0 in 5+ unit buildings).
- This rent runs 36% of the median local income ($72k/yr) — at the standard rent-burdened threshold; future hikes will face affordability resistance.
Forward outlook
- Local home prices are declining (-3.0%/yr); year-one equity from $2k of loan paydown is wiped out by about $7k of value loss. Plan a longer hold.
- Cass County population projected to shrink 3% by 2050 — rents likely to lag national; underwrite the cash flow, not the appreciation.
Negotiation context
- Only 3 days on market — expect competitive offers; lowballing is unlikely to land.
- 10 sale attempts since 14y ago with the ask held roughly flat each time — persistent listings suggest the price (not the market) is what's stuck; bring a comps-based counter.
Risks & watch-outs
- Watch-outs: built in 1955 — expect roof / HVAC / electrical / plumbing capex.
Questions for the listing agent
- Built in 1955 — when were the roof, HVAC, electrical panel, plumbing, and water heater last replaced?
- Is there a deadline driving the sale (1031 exchange, divorce, estate, relocation)? That informs how much negotiation room exists.
- Schools are D-rated, which usually means shorter tenancies and higher turnover. Who's the typical renter profile here, and what's been the actual vacancy rate?
- The area grade is low — what's the realistic commute time and amenity access for the typical tenant pool here? Any planned neighborhood developments (good or bad) we should know about?
- What's the average days-on-market for RENTAL listings here right now (not sales)? A rising rental-DOM trend means longer vacancies and softer asking-rent achievability than the comps imply.
- What's the recent tenant-quality profile in this submarket — average credit score on applications, eviction rate, late-payment / NSF rate, and stable-employment percentage? A property-management company in the area should have these aggregated.
- How much new for-sale + rental construction is in the pipeline within 1–3 miles? Heavy new supply typically softens prices + rents 12–24 months out; constrained supply supports both.
Investment metrics
- 1% rule
- 0.90% ✗
- Cap rate
- 7.61%
- Cash-on-cash
- 4.69%
- DSCR
- 1.21
- GRM
- 9.3
CMA / ARV
- ARV (on-the-fly)
- $198,576
- Comps found
- 2
Show comp detail 2 sales within ~0.75 mi
| Address | Dist | Beds/Ba | Sqft | Sold | Price | $/sf | Match |
|---|---|---|---|---|---|---|---|
| 18714 S Lakeside Ln | 0.14mi | 3/2.0 | 1,140 (+13%) | 3mo | $225,000 | $197 | 69 |
| 18802 S Lakeside Ln | 0.15mi | 2/1.0 (-1) | 864 (-14%) | 0mo | $139,000 | $161 | 60 |
Match score weights: distance 35% · size 25% · config 20% · recency 20%. Top-matched comps best support the ARV.
Projected returns pro-forma
-3.0% appreciation · 5.17% rent growth · sell at horizon
- IRR
- -6.9%
- Equity multiple
- 0.74×
- Total profit
- $-17,425
- Equity at exit
- $35,770
- IRR
- 5.0%
- Equity multiple
- 1.40×
- Total profit
- $26,635
- Equity at exit
- $20,742
Cash invested: $67,172 (down + closing). Projections, not guarantees.
Landlord ↔ Tenant lean methodology
- Overall (STATE)
- 81 Strongly Landlord-Friendly
- State Missouri
- 81 Strongly Landlord-Friendly · R+10
- County
- — inherits STATE
- City
- — inherits STATE
ZIP-level market 64012
- Rents YoY
- 5.2%
- Active inventory
- 204
- Price-to-rent
- 9.3×
Monthly cashflow live
- Estimated rent
- $2,160 medium interval (Pro) →
- Mortgage (P&I)
- −$1,258
- Tax from tax record
- −$86 /mo · $1,028/yr
- Insurance
- −$100
- HOA
- −$0
- Vacancy / Maint / Mgmt
- −$454
- Net cashflow
- $263
Break-even live
UW: 25.0% down · 7.5% · 30yr · 1.5% tax · 5.0% vac · 8.0% maint · 8.0% mgmt
Financing live
Cash to close
- Down payment
- $59,975
- Closing costs
- $7,197
- Reserves months
- —
- Total cash needed
- —
Loan-product check · same deal, 3 products live
Conventional
25% down · 7.5% · 30yr
- Down + closing
- —
- Monthly P&I
- —
- Monthly cashflow
- —
- DSCR
- —
- Eligible?
- —
Personal DTI + credit; lowest rate.
DSCR
20% down · 8.5% · 30yr
- Down + closing
- —
- Monthly P&I
- —
- Monthly cashflow
- —
- DSCR
- —
- Eligible?
- —
No personal income docs; deal must DSCR.
Hard money
10% down · 12.0% · 12mo
- Down + closing
- —
- Monthly P&I
- —
- Monthly cashflow
- —
- DSCR
- —
- Eligible?
- —
Short-term bridge; refi at stabilization.
Rent comps 2 comps
| Address | Beds | Baths | Sqft | Rent | $/sqft | DOM | Units | Dist |
|---|---|---|---|---|---|---|---|---|
| 960 Cedarcrest Dr Raymore, MO | 2.0–3.0 | 2.0–2.5 | 1305 | $2,035 | $1.56 | 1d | 11 | 1.43mi |
| 1702 Pam Ct Belton, MO | 4.0 | 3.0 | 1443 | $2,099 | $1.45 | 43d | 1 | 1.46mi |
Listing history 3 events
-
2026-06-07statusdays on market $239,900 Pending 3 DOM
-
2026-06-05remarks 699-char remark
-
2026-06-05$239,900 Active 1 DOM
ⓘ Source: listings_history table (triggers on properties + properties_extension) + one-shot
backfill from property_details.listing_events for pre-trigger history.
Tax reassessment forecast MO · Resets to sale price
- Current annual tax
- $1,028 · $86/mo
- Projected year-2 tax
- $2,327 · $194/mo
- Expected delta
- +$1,299/yr (+$108/mo · 126.3%)
ⓘ Screening estimate from a state-policy table — verify with the county assessor before closing.
Climate risk First Street
- Flood 1/10 Low FEMA zone X (unshaded) · 0% chance over 30 yrs
- Wildfire 2/10 Low
- Heat 4/10 Moderate 7 d/yr ≥107°F today · 17 d/yr by 30 yrs out
- Wind 2/10 Low 100% chance of damaging wind over 30 yrs
- Air quality 2/10 Low 2 unhealthy d/yr today · 2 by 30 yrs out
Nearby sold comps map
Loading sold comps map…
Walkable amenities ~0.75 mi
Loading nearby amenities…
Taxation est. · year 1
- Rental income
- $25,920
- − Mortgage interest
- −$13,438
- − Property taxes
- −$1,028
- − Insurance
- −$1,200
- − Repairs & maintenance
- −$2,074
- − Management
- −$2,074
- − Depreciation
- −$6,979
- Taxable loss
- −$872
- Est. tax savings @ 24.0%
- +$209
- After-tax cash flow
- $3,361/yr
For passive investors: Depreciation is non-cash, so a rental often shows a tax loss while cash-flowing — sheltering income. Rental losses are passive: they offset passive income freely, and up to $25,000/yr can offset ordinary (W-2) income if you actively participate and your MAGI is under $100k (phasing out to $0 by $150k); unused losses carry forward. On sale, claimed depreciation is recaptured at up to 25%, and gains may owe capital-gains tax (a 1031 exchange can defer both). Figures are a year-1 estimate at your 24.0% rate — not tax advice; consult a CPA.
Schools (NCES district)
- District
- Belton 124
- NCES district ID
- 2904620
- Math proficiency
- 28% ▼ -9.00%
- Reading proficiency
- 39% ▼ -9.00%
- Median HH income
- $56,946
- Composite
- 29.73/100
- National rank
- #6446
- State rank
- #216 of 324 in MO
Livability — Belton
- Score
- 76/100
- State rank
- #52
- US rank
- #3782
Category grades
Schools grade is shown separately in the Schools card above.
Census & demographics
- County
- Cass County · 65,358 people
- City population
- 29,304
- Metro
- Kansas City, MO-KS
- Population (ZIP)
- 29,304
- Household income
- $71,814
- Rent vs Own
- Severe rent burden
- 1081.0
Population outlook (Cass County) Hauer SSP2
- Today (2025)
- 105,292 people
- By 2030
- 106,109 · +0.8%
- By 2040
- 105,786 · +0.5%
- By 2050
- 102,062 · -3.1%
- By 2075
- 88,569 · -15.9%
- By 2100
- 68,293 · -35.1%
Race, ethnicity, and origin ACS 2023
- Neighborhood character
- Predominantly White (80%)
- Race & ethnicity
- White 80% Two or more races 7% Hispanic / Latino 7% Black 6% Asian 1%
- Hispanic origin (detail)
- Mexican 5%
- Common ancestry
- Italian 2% Lithuanian 2% Portuguese 2%
- Foreign-born
- 2% · Canada
- Languages at home
- 96% English-only · Spanish 2% German/W. Germanic 1% Other Asian/Pacific 1%
Political lean MEDSL · Cass
- 2024 margin
- Solid R (+32.1) · D 33.3% · R 65.4% · Other 1.3%
- 2008→2024 swing
- -12.5pp toward R · 2008: -19.6pp · 2024: -32.1pp
- All cycles
- 2024: R+32.1 2020: R+31.6 2016: R+35.9 2012: R+28.4 2008: R+19.6
Not yet ingested
- Civics
- —
Market trends
- HPI YoY
- ▼ -244.76%
- Current HPI
- 214.6157
- Rent YoY
- ▲ 5.17%
- Metro
- Kansas City, MO-KS
- State GDP YoY
- ▲ 1.84%
- F500 in state
- 20
Industry mix (Fortune 500 HQ in MO)
| Industry | F500 HQs | Revenue |
|---|---|---|
| Healthcare | 1 | $163B |
|
||
| Insurance | 1 | $21B |
|
||
| Industrial Technology | 1 | $17B |
|
||
| Retail | 1 | $16B |
|
||
| Industrial Distribution | 1 | $10B |
|
||
| Utilities | 1 | $9B |
|
||
Price history
+169.6% since first listed27 events — show timeline
- 2026-06-03 Listed $239,900 Heartland MLS as Distributed by MLS Grid
- 2024-01-10 Sold (Public Records) — Public Records
- 2024-01-08 Sold (MLS) — Heartland MLS as Distributed by MLS Grid
- 2023-12-29 Pending — Heartland MLS as Distributed by MLS Grid
- 2023-12-17 Relisted — Heartland MLS as Distributed by MLS Grid
- 2023-12-09 Contingent — Heartland MLS as Distributed by MLS Grid
- 2023-11-17 Listed $237,500 Heartland MLS as Distributed by MLS Grid
- 2022-08-27 Pending — Heartland MLS as Distributed by MLS Grid
- 2022-08-26 Listed $110,000 Heartland MLS as Distributed by MLS Grid
- 2022-08-26 Listing Removed — Heartland MLS as Distributed by MLS Grid
- 2021-11-13 Listing Removed — Heartland MLS as Distributed by MLS Grid
- 2021-11-06 Relisted — Heartland MLS as Distributed by MLS Grid
- 2021-10-28 Pending — Heartland MLS as Distributed by MLS Grid
- 2021-10-19 Price Changed $127,500 Heartland MLS as Distributed by MLS Grid
- 2021-09-10 Listed $135,000 Heartland MLS as Distributed by MLS Grid
- 2016-11-23 Sold (Public Records) — Public Records
- 2016-11-22 Sold (MLS) — Heartland MLS as Distributed by MLS Grid
- 2016-09-16 Contingent — Heartland MLS as Distributed by MLS Grid
- 2016-07-26 Relisted — Heartland MLS as Distributed by MLS Grid
- 2016-07-21 Contingent — Heartland MLS as Distributed by MLS Grid
- 2016-05-25 Relisted — Heartland MLS as Distributed by MLS Grid
- 2016-05-17 Contingent — Heartland MLS as Distributed by MLS Grid
- 2016-05-07 Listed $94,500 Heartland MLS as Distributed by MLS Grid
- 2013-02-15 Sold (Public Records) — Public Records
- 2012-12-30 Listing Removed — Heartland MLS as Distributed by MLS Grid
- 2012-06-07 Listed $89,000 Heartland MLS as Distributed by MLS Grid
- 2011-12-09 Sold (Public Records) — Public Records
Property tax history
+3.3%/yrLatest (2025): $1,028 · +13.4% YoY. Source: county tax records.
Cash-flow waterfall
monthlySold comps — $/sqft
last 12 mo · ≤1 miLoading sold comps…