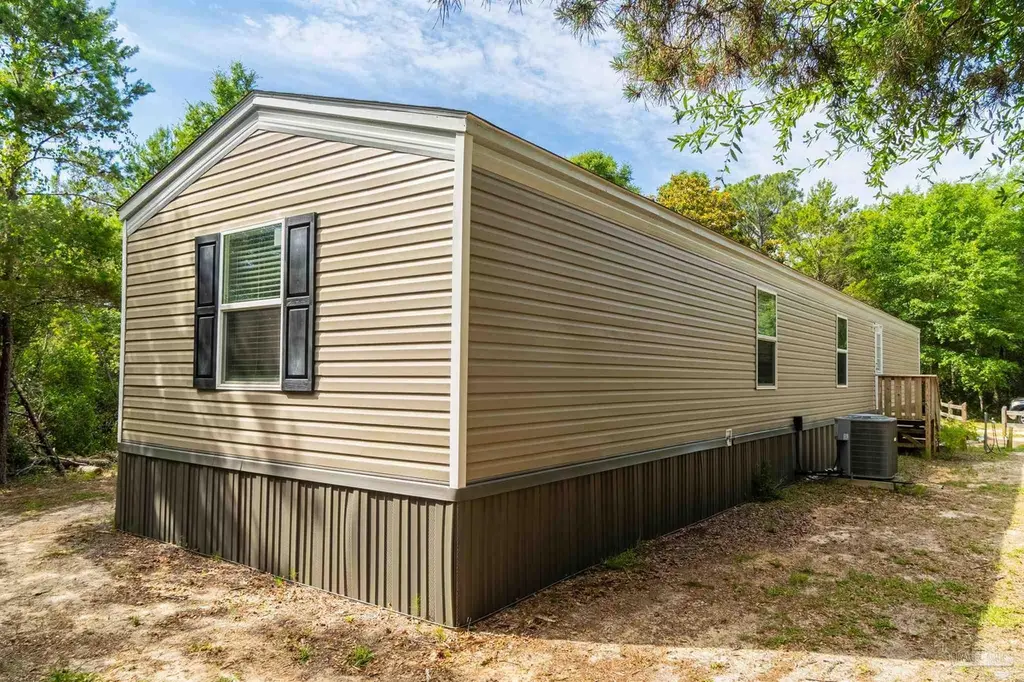
12301 Gulf Beach Hwy
Pensacola Station, FL 32507
$96,000B+
3 bd · 2.0 ba ·
1,250 sqft ·
Built 2022
· Manufactured
· Active
· 26 DOM
Cashflow @ list (25.0% down · 7.5%)
Estimated rent
$2,047/mo
Mortgage (P&I)
−$503
Tax + insurance
−$829
HOA
−$0
Vac / Maint / Mgmt
−$430
Net cashflow
$285/mo
Annual
$3,419/yr
Cap rate
18.22%
Cash-on-cash
42.59%
DSCR
2.89
1% rule
2.13%
Cash to close
$26,880
Investor read
- This is a 3-bed/2.0-bath manufactured listed at $96k. Condition is rated good.
- At list price, monthly cash flow is $285 ($3k/yr) — positive.
- The deal already cash-flows at list — no discount required.
- Meets the 1% rule at list price ($2k rent vs $96k).
- It's been on market 26 days — a 2% lower offer ($95k) is reasonable based on typical stale-listing flexibility.
- Recommended offer: $95k (1.5% below list) — sets the bar for market timing.
- Local home prices are declining (-3.0%/yr); year-one equity from $664 of loan paydown is wiped out by about $3k of value loss. Plan a longer hold.
- Location reads: area grade B — affects rentability + tenant quality, not the cash-flow math above.
- Escambia (suburban): math 40% / reading 45% proficiency, ranked #56 of 73 in FL (top 77%) — families likely to look elsewhere, expect single-tenant / working-renter base with shorter leases.
- Watch-outs: flood insurance adds $669/mo.
- Market conditions: Rents rising (+1.2%/yr); 702 active listings in the ZIP; 4 comparable units currently listed for rent nearby; rentals at typical pace (median 24d on market — plan ~3-4 weeks tenant-placement turnaround); 1,479 units permitted in Escambia County in 2024 (0 in 5+ unit buildings).
- Escambia County population projected at +13% by 2050 — modest demand growth; plan on rents tracking national, not racing it.
- Climate carrying-cost: in FEMA flood zone VE (mandatory federal flood insurance); severe wind risk, 99% chance of damaging wind over 30y; moderate wildfire risk; extreme-heat days projected 8→26/yr by 2055 (HVAC capex compounding) — expect insurance premiums to compound above CPI over the hold.
- Cap rate 18.2% vs local median 2.1% in Pensacola Station — top-decile yield for the area; either an underpriced asset or a hidden risk that comps aren't pricing in. Stress-test before assuming the spread holds.
- This rent runs 33% of the median local income ($74k/yr) — at the standard rent-burdened threshold; future hikes will face affordability resistance.
Questions for listing agent
- What's the actual annual flood-insurance premium (NFIP or private), and is the property in a SFHA with mandatory coverage?
- Is there a deadline driving the sale (1031 exchange, divorce, estate, relocation)? That informs how much negotiation room exists.
- What's the average days-on-market for RENTAL listings here right now (not sales)? A rising rental-DOM trend means longer vacancies and softer asking-rent achievability than the comps imply.
- What's the recent tenant-quality profile in this submarket — average credit score on applications, eviction rate, late-payment / NSF rate, and stable-employment percentage? A property-management company in the area should have these aggregated.
- How much new for-sale + rental construction is in the pipeline within 1–3 miles? Heavy new supply typically softens prices + rents 12–24 months out; constrained supply supports both.
CashFlowRE · CFR-73892B39W0HZMP
· Data 2 days ago
cashflowre.app · 2026-05-29