12301 Gulf Beach Hwy · Pensacola Station, FL
Flood risk 10/10 · Severe
- FEMA flood zone
- VE
- Chance of flooding over 30 yrs
- 0.99%
- Est. flood insurance / yr
- $5,013 – $11,043
Fire risk 5/10 · Moderate
- Est. fire insurance / yr
- $947 – $1,759
Heat risk 10/10 · Severe
- Hot days now (above 105°F)
- 8 days/yr
- Hot days in 30 yrs
- 26 days/yr
Wind risk 10/10 · Severe
- Chance of severe wind over 30 yrs
- 99.0%
Air-quality risk 2/10 · Minimal
- Unhealthy air days now
- 1 days/yr
- Unhealthy air days in 30 yrs
- 1 days/yr
Risk factors via First Street. Map © Google.
Why this score? — see what drove the B+ grade
The composite is a weighted blend of 9 inputs, each scored 0–100. Each bar is that input's sub-score; the figure is the points it added to the 100-point composite (weight × sub-score).
- Cash flow +30.0/30.0
- ARV discount +15.0/15.0
- 1% rule +10.0/10.0
- DSCR +10.0/10.0
- Condition / age +4.0/5.0
- Schools +3.6/10.0
- Rent growth +2.8/5.0
- Livability +2.5/5.0
- Appreciation +0.0/10.0
$96,000
🖨 Deal sheet 📄 Offer letter ✓ Due diligence
Listing remarks
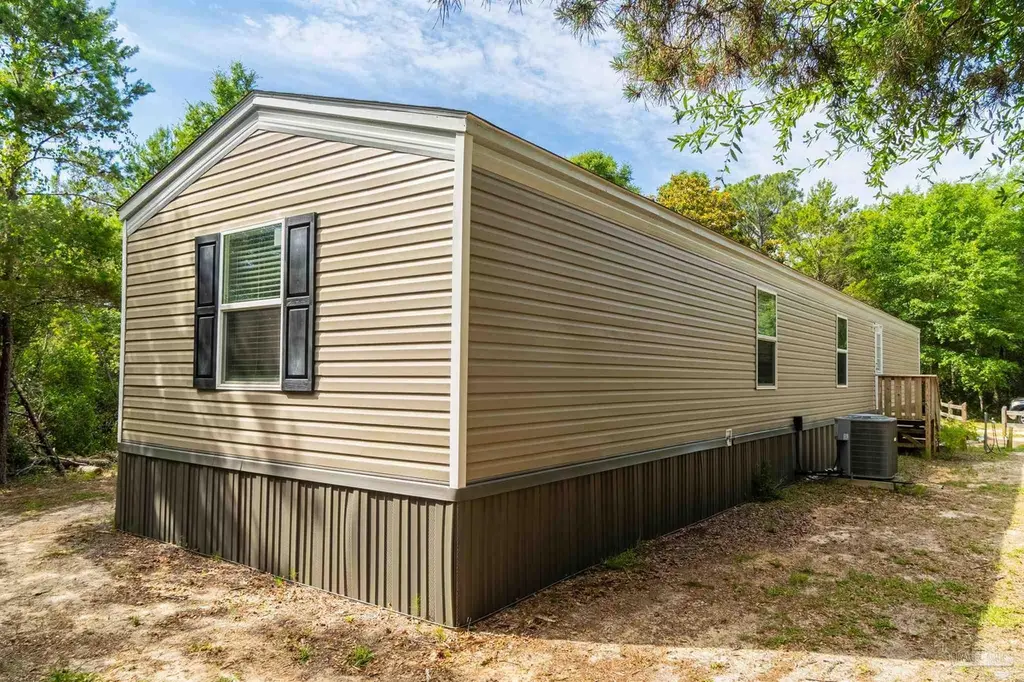
YOUR CHANCE TO OWN PROPERTY UNDER 100K THAT ISN'T A FIXER UPPER. This manufactured home is ready for its new owner with no updates required! Enjoy a spacious 3 bed, 2 bath floorplan and make it your own at an affordable price. This home is equipped with a washer and dryer, fridge, and stove that all convey. Roof, HVAC, plumbing, and electric all 2022. This property is located on Big Lagoon State Park land, land does not convey. New owner may either move this home off state park land or be a state park employee to reside there. Information is deemed reliable, buyer to verify all information during due diligence.
Key facts
- Roof 2022
- Washer and dryer
- Stove
Tags
Property features AI
Finance
- Other: Green energy features: insulated floors and walls
- HOA & community: No association (annual association fee frequency listed)
Exterior
- Parking: Driveway; Open parking
- Utilities: Copper wiring for electric; Public sewer
- Home design: Mobile/manufactured home; One story; Resale property; Homestead eligible
- Construction: Frame construction; Off-grade foundation
- Exterior features: Composition gable roof; Does not allow horses; Private maintained road (unimproved surface)
Interior
- Kitchen: ENERGY STAR qualified dishwasher; ENERGY STAR qualified refrigerator; ENERGY STAR qualified appliances
- Bedrooms: Master bedroom on the first floor; Additional bedrooms on the first floor
- Bathrooms: 2 full bathrooms
- Heating & cooling: Central heating with ENERGY STAR qualified heat pump; Central air with ENERGY STAR qualified equipment
- Interior features: ENERGY STAR qualified doors; Double-pane windows
- Laundry & utility: ENERGY STAR qualified washer; ENERGY STAR qualified dryer; Electric water heater; ENERGY STAR qualified water heater
Neighborhood map
What this means for you Summary
Snapshot
- This is a 3-bed/2.0-bath manufactured listed at $96k. Condition is rated good.
Deal economics
- At list price, monthly cash flow is $285 ($3k/yr) — positive.
- The deal already cash-flows at list — no discount required.
- Meets the 1% rule at list price ($2k rent vs $96k).
- Recommended offer: $95k (1.5% below list) — sets the bar for market timing.
- Cap rate 18.2% vs local median 2.1% in Pensacola Station — top-decile yield for the area; either an underpriced asset or a hidden risk that comps aren't pricing in. Stress-test before assuming the spread holds.
Location & tenants
- Location reads: area grade B — affects rentability + tenant quality, not the cash-flow math above.
- Escambia (suburban): math 40% / reading 45% proficiency, ranked #56 of 73 in FL (top 77%) — families likely to look elsewhere, expect single-tenant / working-renter base with shorter leases.
- Market conditions: Rents rising (+1.2%/yr); 702 active listings in the ZIP; 4 comparable units currently listed for rent nearby; rentals at typical pace (median 24d on market — plan ~3-4 weeks tenant-placement turnaround); 1,479 units permitted in Escambia County in 2024 (0 in 5+ unit buildings).
- This rent runs 33% of the median local income ($74k/yr) — at the standard rent-burdened threshold; future hikes will face affordability resistance.
Forward outlook
- Local home prices are declining (-3.0%/yr); year-one equity from $664 of loan paydown is wiped out by about $3k of value loss. Plan a longer hold.
- Escambia County population projected at +13% by 2050 — modest demand growth; plan on rents tracking national, not racing it.
Negotiation context
- It's been on market 26 days — a 2% lower offer ($95k) is reasonable based on typical stale-listing flexibility.
Risks & watch-outs
- Watch-outs: flood insurance adds $669/mo.
- Climate carrying-cost: in FEMA flood zone VE (mandatory federal flood insurance); severe wind risk, 99% chance of damaging wind over 30y; moderate wildfire risk; extreme-heat days projected 8→26/yr by 2055 (HVAC capex compounding) — expect insurance premiums to compound above CPI over the hold.
Questions for the listing agent
- What's the actual annual flood-insurance premium (NFIP or private), and is the property in a SFHA with mandatory coverage?
- Is there a deadline driving the sale (1031 exchange, divorce, estate, relocation)? That informs how much negotiation room exists.
- What's the average days-on-market for RENTAL listings here right now (not sales)? A rising rental-DOM trend means longer vacancies and softer asking-rent achievability than the comps imply.
- What's the recent tenant-quality profile in this submarket — average credit score on applications, eviction rate, late-payment / NSF rate, and stable-employment percentage? A property-management company in the area should have these aggregated.
- How much new for-sale + rental construction is in the pipeline within 1–3 miles? Heavy new supply typically softens prices + rents 12–24 months out; constrained supply supports both.
Investment metrics
- 1% rule
- 2.13% ✓
- Cap rate
- 18.22%
- Cash-on-cash
- 42.59%
- DSCR
- 2.89
- GRM
- 3.9
CMA / ARV
- ARV (on-the-fly)
- $171,250
- Comps found
- 1
Show comp detail 1 sale within ~0.75 mi
| Address | Dist | Beds/Ba | Sqft | Sold | Price | $/sf | Match |
|---|---|---|---|---|---|---|---|
| 5300 Cambria | 0.71mi | 3/1.5 | 1,280 (+2%) | 20mo | $175,000 | $137 | 44 |
Match score weights: distance 35% · size 25% · config 20% · recency 20%. Top-matched comps best support the ARV.
Projected returns pro-forma
-3.0% appreciation · 1.22% rent growth · sell at horizon
- IRR
- -0.6%
- Equity multiple
- 0.98×
- Total profit
- $-570
- Equity at exit
- $14,314
- IRR
- 6.0%
- Equity multiple
- 1.39×
- Total profit
- $10,403
- Equity at exit
- $8,300
Cash invested: $26,880 (down + closing). Projections, not guarantees.
Landlord ↔ Tenant lean methodology
- Overall (STATE)
- 87 Strongly Landlord-Friendly
- State Florida
- 87 Strongly Landlord-Friendly · R+3
- County
- — inherits STATE
- City
- — inherits STATE
ZIP-level market 32507
- Home prices YoY
- -4.6%
- Rents YoY
- 1.2%
- Active inventory
- 702
- Price-to-rent
- 3.9×
Monthly cashflow live
- Estimated rent
- $2,047 medium interval (Pro) →
- Mortgage (P&I)
- −$503
- Tax est. 1.5%
- −$120 /mo · $1,440/yr
- Insurance
- −$40
- Flood insurance flood zone
- −$669 /mo · $8,028/yr
- HOA
- −$0
- Vacancy / Maint / Mgmt
- −$430
- Net cashflow
- $285
Break-even live
UW: 25.0% down · 7.5% · 30yr · 1.5% tax · 5.0% vac · 8.0% maint · 8.0% mgmt
Financing live
Cash to close
- Down payment
- $24,000
- Closing costs
- $2,880
- Reserves months
- —
- Total cash needed
- —
Loan-product check · same deal, 3 products live
Conventional
25% down · 7.5% · 30yr
- Down + closing
- —
- Monthly P&I
- —
- Monthly cashflow
- —
- DSCR
- —
- Eligible?
- —
Personal DTI + credit; lowest rate.
DSCR
20% down · 8.5% · 30yr
- Down + closing
- —
- Monthly P&I
- —
- Monthly cashflow
- —
- DSCR
- —
- Eligible?
- —
No personal income docs; deal must DSCR.
Hard money
10% down · 12.0% · 12mo
- Down + closing
- —
- Monthly P&I
- —
- Monthly cashflow
- —
- DSCR
- —
- Eligible?
- —
Short-term bridge; refi at stabilization.
Rent comps 4 comps
| Address | Beds | Baths | Sqft | Rent | $/sqft | DOM | Units | Dist |
|---|---|---|---|---|---|---|---|---|
| 11936 Longwood Dr Pensacola, FL | 3.0 | 2.0 | 1617 | $2,000 | $1.24 | 23d | 1 | 0.27mi |
| 5292 Balfour Pl Pensacola, FL | 2.0 | 2.5 | 1248 | $1,700 | $1.36 | 23d | 1 | 0.50mi |
| 5222 Medina Rd Unit D Pensacola, FL | 2.0 | 2.0 | 998 | $1,700 | $1.70 | 23d | 1 | 0.67mi |
| 5315 Cambria Dr Unit 1367375P Pensacola, FL | 3.0 | 2.0 | 1700 | $2,460 | $1.45 | 13d | 1 | 0.75mi |
Listing history 16 events
-
2026-06-18days on market $96,000 Active 26 DOM
-
2026-06-17days on market $96,000 Active 25 DOM
-
2026-06-16days on market $96,000 Active 24 DOM
-
2026-06-15days on market $96,000 Active 23 DOM
-
2026-06-14days on market $96,000 Active 21 DOM
-
2026-06-10days on market $96,000 Active 18 DOM
-
2026-06-09days on market $96,000 Active 17 DOM
-
2026-06-09price $96,000 Active 16 DOM
-
2026-06-08days on market $98,000 Active 16 DOM
-
2026-06-07days on market $98,000 Active 15 DOM
-
2026-06-03days on market $98,000 Active 11 DOM
-
2026-06-02days on market $98,000 Active 10 DOM
-
2026-06-01days on market $98,000 Active 9 DOM
-
2026-05-31days on market $98,000 Active 8 DOM
-
2026-05-31days on market $98,000 Active 7 DOM
-
2026-05-23$98,000 Active
ⓘ Source: listings_history table (triggers on properties + properties_extension) + one-shot
backfill from property_details.listing_events for pre-trigger history.
Climate risk First Street
- Flood 10/10 Extreme FEMA zone VE · 99% chance over 30 yrs
- Wildfire 5/10 Major
- Heat 10/10 Extreme 8 d/yr ≥105°F today · 26 d/yr by 30 yrs out
- Wind 10/10 Extreme 99% chance of damaging wind over 30 yrs
- Air quality 2/10 Low 1 unhealthy d/yr today · 1 by 30 yrs out
Nearby sold comps map
Loading sold comps map…
Walkable amenities ~0.75 mi
Loading nearby amenities…
Taxation est. · year 1
- Rental income
- $24,568
- − Mortgage interest
- −$5,377
- − Property taxes
- −$1,440
- − Insurance
- −$8,508
- − Repairs & maintenance
- −$1,965
- − Management
- −$1,965
- − Depreciation
- −$2,793
- Taxable income
- $2,519
- Est. tax owed @ 24.0%
- −$604
- After-tax cash flow
- $2,815/yr
For passive investors: Depreciation is non-cash, so a rental often shows a tax loss while cash-flowing — sheltering income. Rental losses are passive: they offset passive income freely, and up to $25,000/yr can offset ordinary (W-2) income if you actively participate and your MAGI is under $100k (phasing out to $0 by $150k); unused losses carry forward. On sale, claimed depreciation is recaptured at up to 25%, and gains may owe capital-gains tax (a 1031 exchange can defer both). Figures are a year-1 estimate at your 24.0% rate — not tax advice; consult a CPA.
Condition & rehab AI · 22 photos
This manufactured home is in good condition with no major repairs needed. It's ready for its new owner and can be enhanced with some cosmetic updates to boost its resale and rental value.
Value-add opportunities
- Resale Paint exterior siding — Fresh paint can enhance curb appeal and property value.
- Resale Trim and paint interior walls — Fresh paint can make the interior look more modern and appealing.
- Rental Clean and organize interior — A clean and organized interior can attract more renters and increase rental value.
Renovation cost estimate screening
Value-add ROI direction
- Resale Paint exterior siding — Fresh paint can enhance curb appeal and property value. ↑
- Resale Trim and paint interior walls — Fresh paint can make the interior look more modern and appealing. ↑
- Rental Clean and organize interior — A clean and organized interior can attract more renters and increase rental value. ↑
ⓘ Cost ranges are severity-bucket heuristics (US national rule-of-thumb). Get contractor quotes + a written scope before underwriting a rehab budget.
Schools (NCES district)
- District
- Escambia
- NCES district ID
- 1200510
- Math proficiency
- 40% ▼ -9.00%
- Reading proficiency
- 45% ▼ -4.00%
- Median HH income
- $44,649
- Composite
- 36.04/100
- National rank
- #4773
- State rank
- #56 of 73 in FL
Livability — Pensacola Station
No livability data for this city. (Only ~50 U.S. cities are tracked.)
Census & demographics
- County
- Escambia County · 301,722 people
- City population
- 4,993
- Metro
- Pensacola-Ferry Pass-Brent, FL
- Population (ZIP)
- 32,226
- Household income
- $73,540
- Rent vs Own
- Severe rent burden
- 1175.0
Population outlook (Escambia County) Hauer SSP2
- Today (2025)
- 334,637 people
- By 2030
- 345,779 · +3.3%
- By 2040
- 364,828 · +9.0%
- By 2050
- 378,514 · +13.1%
- By 2075
- 403,220 · +20.5%
- By 2100
- 386,125 · +15.4%
Race, ethnicity, and origin ACS 2023
- Neighborhood character
- Predominantly White (73%)
- Race & ethnicity
- White 73% Black 10% Two or more races 10% Hispanic / Latino 7% Asian 2%
- Hispanic origin (detail)
- Mexican 3% Puerto Rican 2%
- Common ancestry
- Slovak 3% Lithuanian 2% Romanian 2%
- Foreign-born
- 5% · Canada, Vietnam
- Languages at home
- 92% English-only · Spanish 4% Other Asian/Pacific 1% French/Haitian/Cajun 1%
Political lean MEDSL · Escambia
- 2024 margin
- R (+19.5) · D 39.7% · R 59.2% · Other 1.1%
- 2008→2024 swing
- -0.2pp no change · 2008: -19.3pp · 2024: -19.5pp
- All cycles
- 2024: R+19.5 2020: R+15.1 2016: R+20.6 2012: R+20.6 2008: R+19.3
Not yet ingested
- Civics
- —
Market trends
- HPI YoY
- ▼ -26.23%
- Current HPI
- 548.03
- Rent YoY
- ▲ 1.22%
- Metro
- Pensacola-Ferry Pass-Brent, FL
- State GDP YoY
- ▲ 3.28%
- F500 in state
- 36
Industry mix (Fortune 500 HQ in FL)
| Industry | F500 HQs | Revenue |
|---|---|---|
| Industrial Technology | 2 | $29B |
|
||
| Insurance | 2 | $17B |
|
||
| Retail | 1 | $60B |
|
||
| Technology Distribution | 1 | $58B |
|
||
| Homebuilding | 1 | $35B |
|
||
| Technology Manufacturing | 1 | $35B |
|
||
Price history
1 event — show timeline
- 2026-05-23 Listed $98,000 PARMLS
Cash-flow waterfall
monthlySold comps — $/sqft
last 12 mo · ≤1 miLoading sold comps…