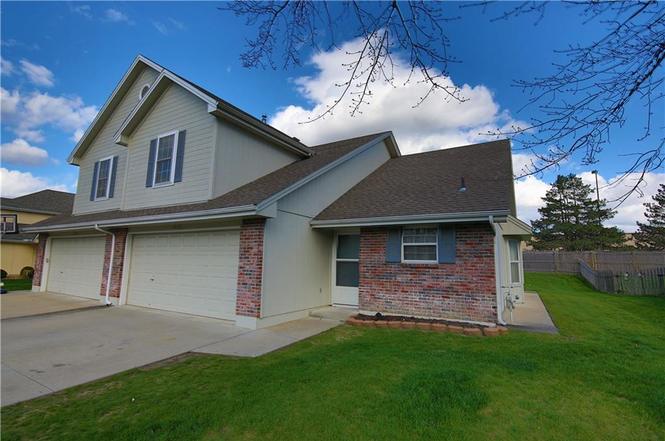
405 SW Hoke Ln
Lee's Summit, MO 64081
$550,000C+
4 bd · 3.0 ba ·
2,968 sqft ·
Built 1996
· MultiFamily
· Active
· 3 DOM
Cashflow @ list (25.0% down · 7.5%)
Estimated rent
$6,621/mo
Mortgage (P&I)
−$2,884
Tax + insurance
−$642
HOA
−$159
Vac / Maint / Mgmt
−$1,390
Net cashflow
$1,546/mo
Annual
$18,547/yr
Cap rate
9.67%
Cash-on-cash
12.04%
DSCR
1.54
1% rule
1.20%
Cash to close
$154,000
Investor read
- This is a 5 × 1-bed/?-bath units multifamily listed at $550k.
- At list price, monthly cash flow is $2k ($19k/yr) — positive. Per door: $309/mo.
- The deal already cash-flows at list — no discount required.
- Meets the 1% rule at list price ($7k rent vs $550k).
- Only 3 days on market — expect competitive offers; lowballing is unlikely to land.
- Local home prices are declining (-3.0%/yr); year-one equity from $4k of loan paydown is wiped out by about $16k of value loss. Plan a longer hold.
- Location reads: area grade C — affects rentability + tenant quality, not the cash-flow math above.
- Lee'S Summit R-VII (suburban): math 46% / reading 55% proficiency, ranked #23 of 324 in MO (top 7%) — acceptable for families but not a draw, mixed tenant base, ~2y average lease; only 16% free/reduced lunch — higher-income household profile.
- Zoned schools: Hazel Grove Elem. (math 39% / reading 51%, grade D-, #410 of 1,115 statewide, top 37%, 341 students, 20% FRL); Lee'S Summit Sr. High (math 31% / reading 66%, grade D, #147 of 521 statewide, top 29%, 1,920 students, 21% FRL) — zoned schools at 20% FRL track the district average.
- Market conditions: Rents rising (+1.2%/yr); 213 active listings in the ZIP; 11 comparable units currently listed for rent nearby; rentals at typical pace (median 17d on market — plan ~3-4 weeks tenant-placement turnaround); solid renter incomes; 4,002 units permitted in Jackson County in 2024 (2,271 in 5+ unit buildings).
- Jackson County population projected at +4% by 2050 — modest demand growth; plan on rents tracking national, not racing it.
- 3 sale attempts since 23y ago with the ask held roughly flat each time — persistent listings suggest the price (not the market) is what's stuck; bring a comps-based counter.
- Cap rate 9.7% vs local median 2.6% in Lee's Summit — top-decile yield for the area; either an underpriced asset or a hidden risk that comps aren't pricing in. Stress-test before assuming the spread holds.
- At $6,621/mo this rent would consume 78% of the median local household income ($102k/yr) (locally 1274% of renters already pay >50% of income on rent) — very limited rent-growth headroom before tenants either downsize or default.
Questions for listing agent
- Can we see the unit-by-unit rent roll, current vacancy, and any below-market leases? What's the average tenancy length?
- What capital expenditures (roof, boiler, parking lot, exteriors) have been made in the last 5 years, and what's planned in the next 2?
- What does the HOA fee cover, when was the last increase, and are there any pending special assessments or reserve-fund shortfalls?
- Is there a deadline driving the sale (1031 exchange, divorce, estate, relocation)? That informs how much negotiation room exists.
- What's the average days-on-market for RENTAL listings here right now (not sales)? A rising rental-DOM trend means longer vacancies and softer asking-rent achievability than the comps imply.
- What's the recent tenant-quality profile in this submarket — average credit score on applications, eviction rate, late-payment / NSF rate, and stable-employment percentage? A property-management company in the area should have these aggregated.
- How much new apartment / multifamily construction is in the pipeline within 1–3 miles? Heavy new supply (>2% of stock underway) typically softens rents 12–24 months out; light construction supports rent growth.
CashFlowRE · CFR-73VMRSE2GTK3FF
· Data 2 days ago
cashflowre.app · 2026-05-29