 5-Plex
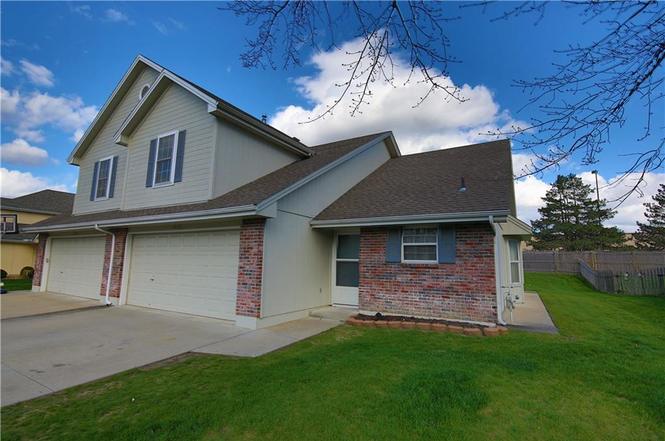
405 SW Hoke Ln · Lee's Summit, MO
Flood risk 1/10 · Minimal
- FEMA flood zone
- X (unshaded)
- Chance of flooding over 30 yrs
- 0.0%
- Est. flood insurance / yr
- $507 – $1,088
Fire risk 3/10 · Minor
- Est. fire insurance / yr
- $1,054 – $1,958
Heat risk 4/10 · Minor
- Hot days now (above 106°F)
- 7 days/yr
- Hot days in 30 yrs
- 17 days/yr
Wind risk 2/10 · Minimal
- Chance of severe wind over 30 yrs
- —
Air-quality risk 3/10 · Minor
- Unhealthy air days now
- 4 days/yr
- Unhealthy air days in 30 yrs
- 4 days/yr
Risk factors via First Street. Map © Google.
Why this score? — see what drove the C+ grade
The composite is a weighted blend of 9 inputs, each scored 0–100. Each bar is that input's sub-score; the figure is the points it added to the 100-point composite (weight × sub-score).
- Cash flow +27.0/30.0
- DSCR +9.4/10.0
- ARV discount +7.5/15.0
- 1% rule +7.0/10.0
- Schools +4.6/10.0
- Rent growth +2.8/5.0
- Livability +2.5/5.0
- Condition / age +2.5/5.0
- Appreciation +0.0/10.0
$550,000
🖨 Deal sheet 📄 Offer letter ✓ Due diligence
Multi-family units
County records classify this as Multi-Family (2-4 Unit). Listing-text estimate: 5 units. estimate disagrees with records
Listing remarks MLS
SHOW 417 HOKE LN-Exceptionally nice 1 1/2 story duplex-2 car garages-vaulted great room ceilings-upscaled single family home neighborhood-open/modern/spacious-great owner occupant rental property-walk to shopping, bank or restaurants. (HOA provides lawn mowing & snow removal)
Key facts
- Walk to dining
- Walk to pharmacy
- Completely remodeled
Tags
Property features AI
Finance
- Other: Property contains 2 total units; both unit types are 4+ bedrooms with 2 baths and approximately 1,750 per unit; Current occupancy over 95%; Age approximately 21–30 years
- Financial info: Gross income reported at $40,800; Operating expenses include property management and other items
- HOA & community: Cedar Creek association; Annual association fee of $1,906; Maintenance provided (lawn and snow removal)
Exterior
- Parking: Attached garage providing 2 parking spaces
- Utilities: Public water; Public sewer; Metro Free telecom service
- Home design: Duplex (residential income property); R-2 zoning; Two stories
- Construction: Brick trim and frame construction; Composition roof
- Exterior features: Lot maintained with lawn and snow removal provided; Not in a flood plain
Interior
- Kitchen: Standard kitchen appliances included (specific appliance list not provided)
- Bedrooms: Each unit has 4+ bedrooms
- Bathrooms: Each unit has 2 bathrooms
- Heating & cooling: Forced air heating (natural gas); Electric cooling
- Interior features: Two-story layout; Individual heating and air systems for units; Individual water heaters
- Laundry & utility: Individual water heaters (one per unit)
Neighborhood map
What this means for you Summary
Snapshot
- This is a 5 × 1-bed/?-bath units multifamily listed at $550k.
Deal economics
- At list price, monthly cash flow is $2k ($19k/yr) — positive. Per door: $309/mo.
- The deal already cash-flows at list — no discount required.
- Meets the 1% rule at list price ($7k rent vs $550k).
- Cap rate 9.7% vs local median 2.6% in Lee's Summit — top-decile yield for the area; either an underpriced asset or a hidden risk that comps aren't pricing in. Stress-test before assuming the spread holds.
Location & tenants
- Location reads: area grade C — affects rentability + tenant quality, not the cash-flow math above.
- Lee'S Summit R-VII (suburban): math 46% / reading 55% proficiency, ranked #23 of 324 in MO (top 7%) — acceptable for families but not a draw, mixed tenant base, ~2y average lease; only 16% free/reduced lunch — higher-income household profile.
- Zoned schools: Hazel Grove Elem. (math 39% / reading 51%, grade D-, #410 of 1,115 statewide, top 37%, 341 students, 20% FRL); Lee'S Summit Sr. High (math 31% / reading 66%, grade D, #147 of 521 statewide, top 29%, 1,920 students, 21% FRL) — zoned schools at 20% FRL track the district average.
- Market conditions: Rents rising (+1.2%/yr); 213 active listings in the ZIP; 11 comparable units currently listed for rent nearby; rentals at typical pace (median 17d on market — plan ~3-4 weeks tenant-placement turnaround); solid renter incomes; 4,002 units permitted in Jackson County in 2024 (2,271 in 5+ unit buildings).
- At $6,621/mo this rent would consume 78% of the median local household income ($102k/yr) (locally 1274% of renters already pay >50% of income on rent) — very limited rent-growth headroom before tenants either downsize or default.
Forward outlook
- Local home prices are declining (-3.0%/yr); year-one equity from $4k of loan paydown is wiped out by about $16k of value loss. Plan a longer hold.
- Jackson County population projected at +4% by 2050 — modest demand growth; plan on rents tracking national, not racing it.
Negotiation context
- Only 3 days on market — expect competitive offers; lowballing is unlikely to land.
- 3 sale attempts since 23y ago with the ask held roughly flat each time — persistent listings suggest the price (not the market) is what's stuck; bring a comps-based counter.
Questions for the listing agent
- Can we see the unit-by-unit rent roll, current vacancy, and any below-market leases? What's the average tenancy length?
- What capital expenditures (roof, boiler, parking lot, exteriors) have been made in the last 5 years, and what's planned in the next 2?
- What does the HOA fee cover, when was the last increase, and are there any pending special assessments or reserve-fund shortfalls?
- Is there a deadline driving the sale (1031 exchange, divorce, estate, relocation)? That informs how much negotiation room exists.
- What's the average days-on-market for RENTAL listings here right now (not sales)? A rising rental-DOM trend means longer vacancies and softer asking-rent achievability than the comps imply.
- What's the recent tenant-quality profile in this submarket — average credit score on applications, eviction rate, late-payment / NSF rate, and stable-employment percentage? A property-management company in the area should have these aggregated.
- How much new apartment / multifamily construction is in the pipeline within 1–3 miles? Heavy new supply (>2% of stock underway) typically softens rents 12–24 months out; light construction supports rent growth.
Investment metrics
- 1% rule
- 1.20% ✓
- Cap rate
- 9.67%
- Cash-on-cash
- 12.04%
- DSCR
- 1.54
- GRM
- 6.9
CMA / ARV
No comps found within radius.
Projected returns pro-forma
-3.0% appreciation · 1.23% rent growth · sell at horizon
- IRR
- -0.4%
- Equity multiple
- 0.99×
- Total profit
- $-2,243
- Equity at exit
- $82,007
- IRR
- 7.4%
- Equity multiple
- 1.51×
- Total profit
- $79,033
- Equity at exit
- $47,554
Cash invested: $154,000 (down + closing). Projections, not guarantees.
Landlord ↔ Tenant lean methodology
- Overall (STATE)
- 81 Strongly Landlord-Friendly
- State Missouri
- 81 Strongly Landlord-Friendly · R+10
- County
- — inherits STATE
- City
- — inherits STATE
ZIP-level market 64081
- Rents YoY
- 1.2%
- Active inventory
- 213
- Price-to-rent
- 34.6×
Monthly cashflow live
- Estimated rent
- $6,621 high interval (Pro) →
- Mortgage (P&I)
- −$2,884
- Tax from tax record
- −$413 /mo · $4,951/yr
- Insurance
- −$229
- HOA
- −$159
- Vacancy / Maint / Mgmt
- −$1,390
- Net cashflow
- $1,546
Break-even live
5-unit breakdown (identical units grouped — click to expand)
| Units | Beds | Baths | Est. rent |
|---|---|---|---|
| 5× units | 1 | — | $6,620 |
| #1 | 1 | — | $1,324 |
| #2 | 1 | — | $1,324 |
| #3 | 1 | — | $1,324 |
| #4 | 1 | — | $1,324 |
| #5 | 1 | — | $1,324 |
| Total (5 units) | $6,621 | ||
UW: 25.0% down · 7.5% · 30yr · 1.5% tax · 5.0% vac · 8.0% maint · 8.0% mgmt
Financing live
Cash to close
- Down payment
- $137,500
- Closing costs
- $16,500
- Reserves months
- —
- Total cash needed
- —
Loan-product check · same deal, 3 products live
Conventional
25% down · 7.5% · 30yr
- Down + closing
- —
- Monthly P&I
- —
- Monthly cashflow
- —
- DSCR
- —
- Eligible?
- —
Personal DTI + credit; lowest rate.
DSCR
20% down · 8.5% · 30yr
- Down + closing
- —
- Monthly P&I
- —
- Monthly cashflow
- —
- DSCR
- —
- Eligible?
- —
No personal income docs; deal must DSCR.
Hard money
10% down · 12.0% · 12mo
- Down + closing
- —
- Monthly P&I
- —
- Monthly cashflow
- —
- DSCR
- —
- Eligible?
- —
Short-term bridge; refi at stabilization.
Rent comps 11 comps
| Address | Beds | Baths | Sqft | Rent | $/sqft | DOM | Units | Dist |
|---|---|---|---|---|---|---|---|---|
| 709 SW 7th St Lees Summit, MO | 4.0 | 2.0 | 2400 | $2,400 | $1.00 | 44d | 1 | 0.55mi |
| 305 SW Ensley Ln Lees Summit, MO | 3.0 | 2.5 | 2090 | $1,875 | $0.90 | 24d | 1 | 0.57mi |
| 1240 SW Crossing Dr Lees Summit, MO | 4.0 | 2.0 | 2261 | $2,729 | $1.21 | 3d | 1 | 0.84mi |
| 1402 SW Winthrop Dr Lee's Summit, MO | 4.0 | 3.0 | 2278 | $3,000 | $1.32 | 44d | 1 | 1.06mi |
| 1408 SW Winthrop Dr Lee's Summit, MO | 4.0 | 3.0 | 2278 | $3,100 | $1.36 | 7d | 1 | 1.08mi |
| 1414 SW Winthrop Dr Lee's Summit, MO | 4.0 | 3.0 | 2278 | $3,100 | $1.36 | 7d | 1 | 1.10mi |
| 1306 SW Walnut St Lees Summit, MO | 4.0 | 3.5 | 2106 | $2,325 | $1.10 | 16d | 1 | 1.10mi |
| 1420 SW Winthrop Dr Lee's Summit, MO | 4.0 | 3.0 | 2278 | $3,100 | $1.36 | 7d | 1 | 1.11mi |
| 1424 SW Winthrop Ter Lees Summit, MO | 4.0 | 3.0 | 2278 | $3,100 | $1.36 | 4d | 1 | 1.13mi |
| 1442 SW Winthrop Ter Lees Summit, MO | 4.0 | 3.0 | 2278 | $3,000 | $1.32 | 44d | 1 | 1.18mi |
| 1450 SW Winthrop Dr Lee's Summit, MO | 4.0 | 3.0 | 2278 | $3,000 | $1.32 | 44d | 1 | 1.20mi |
HOA detail
- Monthly dues
- $159 · $1,908/yr
- Likely covers
- snow removal
Listing history 4 events
-
2026-06-18days on market $550,000 Active 3 DOM
-
2026-06-17statusdays on market $550,000 Active 2 DOM
-
2026-06-13remarks 371-char remark
-
2026-06-13$550,000 Pending 1 DOM
ⓘ Source: listings_history table (triggers on properties + properties_extension) + one-shot
backfill from property_details.listing_events for pre-trigger history.
Tax reassessment forecast MO · Resets to sale price
- Current annual tax
- $4,951 · $413/mo
- Projected year-2 tax
- $5,335 · $445/mo
- Expected delta
- +$384/yr (+$32/mo · 7.8%)
ⓘ Screening estimate from a state-policy table — verify with the county assessor before closing.
Climate risk First Street
- Flood 1/10 Low FEMA zone X (unshaded) · 0% chance over 30 yrs
- Wildfire 3/10 Moderate
- Heat 4/10 Moderate 7 d/yr ≥106°F today · 17 d/yr by 30 yrs out
- Wind 2/10 Low
- Air quality 3/10 Moderate 4 unhealthy d/yr today · 4 by 30 yrs out
Nearby sold comps map
Loading sold comps map…
Walkable amenities ~0.75 mi
Loading nearby amenities…
Taxation est. · year 1
- Rental income
- $79,452
- − Mortgage interest
- −$30,809
- − Property taxes
- −$4,951
- − Insurance
- −$2,750
- − Repairs & maintenance
- −$6,356
- − Management
- −$6,356
- − HOA
- −$1,908
- − Depreciation
- −$16,000
- Taxable income
- $10,322
- Est. tax owed @ 24.0%
- −$2,477
- After-tax cash flow
- $16,070/yr
For passive investors: Depreciation is non-cash, so a rental often shows a tax loss while cash-flowing — sheltering income. Rental losses are passive: they offset passive income freely, and up to $25,000/yr can offset ordinary (W-2) income if you actively participate and your MAGI is under $100k (phasing out to $0 by $150k); unused losses carry forward. On sale, claimed depreciation is recaptured at up to 25%, and gains may owe capital-gains tax (a 1031 exchange can defer both). Figures are a year-1 estimate at your 24.0% rate — not tax advice; consult a CPA.
Schools (NCES district)
- District
- Lee'S Summit R-VII
- NCES district ID
- 2918300
- Math proficiency
- 46% ▼ -12.00%
- Reading proficiency
- 55% ▼ -6.00%
- Median HH income
- $77,031
- Composite
- 45.75/100
- National rank
- #2570
- State rank
- #23 of 324 in MO
Livability — Lee's Summit
No livability data for this city. (Only ~50 U.S. cities are tracked.)
Census & demographics
- Census place
- Lee's Summit, MO
- County
- Jackson County · 687,798 people
- City population
- 86,407
- Metro
- Kansas City, MO-KS
- Population (ZIP)
- 25,305
- Household income
- $102,119
- Rent vs Own
- Severe rent burden
- 1274.0
Population outlook (Jackson County) Hauer SSP2
- Today (2025)
- 719,589 people
- By 2030
- 731,456 · +1.6%
- By 2040
- 746,689 · +3.8%
- By 2050
- 749,289 · +4.1%
- By 2075
- 736,227 · +2.3%
- By 2100
- 668,210 · -7.1%
Race, ethnicity, and origin ACS 2023
- Neighborhood character
- Predominantly White (75%)
- Race & ethnicity
- White 75% Black 12% Two or more races 7% Hispanic / Latino 5% Asian 3%
- Hispanic origin (detail)
- Mexican 3%
- Common ancestry
- Italian 5% Slovak 2% Lithuanian 2%
- Foreign-born
- 4% · Canada, Jamaica
- Languages at home
- 95% English-only · Spanish 3%
Political lean MEDSL · Jackson
- 2024 margin
- D (+19.3) · D 58.9% · R 39.5% · Other 1.6%
- 2008→2024 swing
- -6.1pp toward R · 2008: 25.4pp · 2024: 19.3pp
- All cycles
- 2024: D+19.3 2020: D+22.0 2016: D+16.6 2012: D+19.0 2008: D+25.4
Not yet ingested
- Civics
- —
Market trends
- HPI YoY
- ▼ -196.30%
- Current HPI
- 233.9425
- Rent YoY
- ▲ 1.23%
- Metro
- Kansas City, MO-KS
- State GDP YoY
- ▲ 1.84%
- F500 in state
- 20
Industry mix (Fortune 500 HQ in MO)
| Industry | F500 HQs | Revenue |
|---|---|---|
| Healthcare | 1 | $163B |
|
||
| Insurance | 1 | $21B |
|
||
| Industrial Technology | 1 | $17B |
|
||
| Retail | 1 | $16B |
|
||
| Industrial Distribution | 1 | $10B |
|
||
| Utilities | 1 | $9B |
|
||
Price history
+120.1% since first listed9 events — show timeline
- 2026-06-12 Pending — Heartland MLS as Distributed by MLS Grid
- 2026-06-11 Listed $550,000 Heartland MLS as Distributed by MLS Grid
- 2005-08-16 Sold (Public Records) — Public Records
- 2005-08-12 Sold (MLS) — Heartland MLS as Distributed by MLS Grid
- 2005-04-11 Listed $279,900 Heartland MLS as Distributed by MLS Grid
- 2003-03-04 Sold (Public Records) — Public Records
- 2003-03-03 Sold (MLS) — Heartland MLS as Distributed by MLS Grid
- 2003-02-01 Listed $249,900 Heartland MLS as Distributed by MLS Grid
- 1995-07-06 Sold (Public Records) — Public Records
Property tax history
+4.7%/yrLatest (2025): $4,951 · +5.4% YoY. Source: county tax records.
Cash-flow waterfall
monthlySold comps — $/sqft
last 12 mo · ≤1 miLoading sold comps…