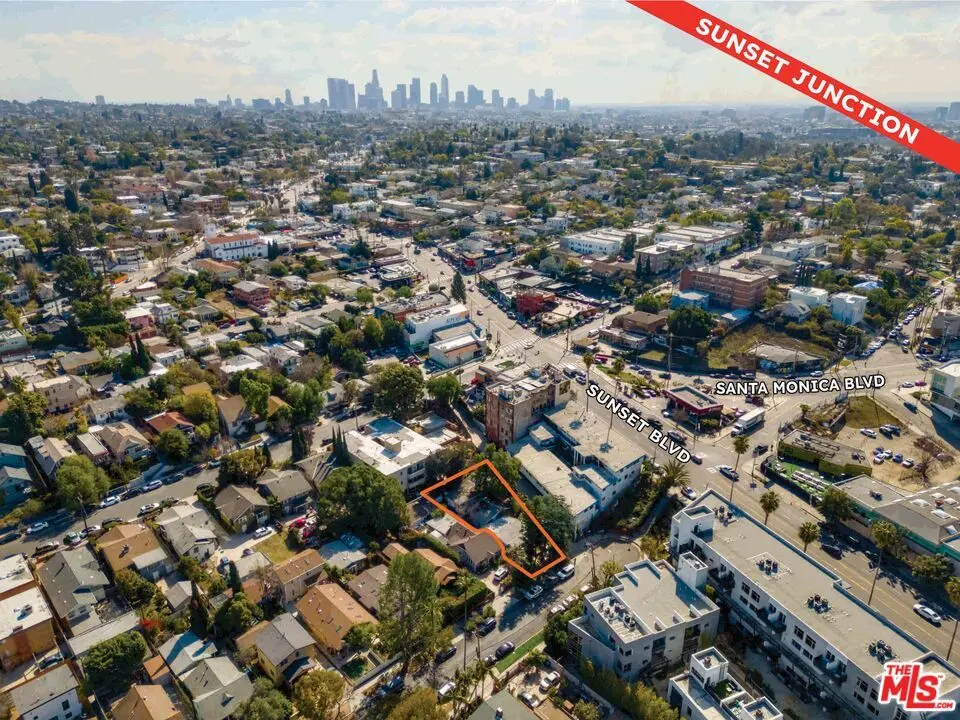
1108 Manzanita St
Los Angeles, CA 90029
$2,350,000D
3 bd · 2.0 ba ·
1,260 sqft ·
Built 1920
· MultiFamily
· Active
· 146 DOM
Cashflow @ list (25.0% down · 7.5%)
Estimated rent
$132,340/mo
Mortgage (P&I)
−$12,324
Tax + insurance
−$2,195
HOA
−$0
Vac / Maint / Mgmt
−$27,791
Net cashflow
$90,030/mo
Annual
$1,080,355/yr
Cap rate
52.27%
Cash-on-cash
164.19%
DSCR
8.31
1% rule
5.63%
Cash to close
$658,000
Investor read
- This is a 3-bed/2.0-bath multifamily listed at $2.35M.
- At list price, monthly cash flow is $90k ($1.08M/yr) — positive.
- The deal already cash-flows at list — no discount required.
- Meets the 1% rule at list price ($132k rent vs $2.35M).
- It's been on market 146 days — a 12% lower offer ($2.07M) is reasonable based on typical stale-listing flexibility.
- Recommended offer: $2.07M (12.0% below list) — sets the bar for market timing.
- Local home prices are declining (-3.0%/yr); year-one equity from $16k of loan paydown is wiped out by about $70k of value loss. Plan a longer hold.
- Location reads 68/100 on livability (#273 in CA) — a middle-class / working-renter tenant base. Strengths: amenities A+, commute A+, employment B; Watch: health & safety C-, schools D+, crime F.
- Los Angeles Unified (urban): math 29% / reading 54% proficiency, ranked #223 of 517 in CA (top 43%) — families likely to look elsewhere, expect single-tenant / working-renter base with shorter leases; 67% free/reduced lunch — lower-income household profile, screen leases tightly.
- Watch-outs: built in 1920 — expect roof / HVAC / electrical / plumbing capex.
- Market conditions: Rents flat; 76 active listings in the ZIP; 40 comparable units currently listed for rent nearby; rentals at typical pace (median 25d on market — plan ~3-4 weeks tenant-placement turnaround); 40% of comp listings sitting > 30 days — soft ceiling on asking rent; 19,697 units permitted in Los Angeles County in 2024 (9,426 in 5+ unit buildings).
- Los Angeles County population projected at +9% by 2050 — modest demand growth; plan on rents tracking national, not racing it.
- 5 sale attempts since 7y ago with the ask held roughly flat each time — persistent listings suggest the price (not the market) is what's stuck; bring a comps-based counter.
- Current owner paid $1.10M; list at $2.35M implies a 114% gain — meaningful room to come down on a strong offer.
- At projected returns (-3.0% appreciation + 0.2% rent growth), your $658k cash investment doubles in ~1 year — after that, you're playing with house money.
- Climate carrying-cost: moderate flood risk; extreme-heat days projected 7→22/yr by 2055 (HVAC capex compounding) — expect insurance premiums to compound above CPI over the hold.
- Cap rate 52.3% vs local median 2.1% in Los Angeles — top-decile yield for the area; either an underpriced asset or a hidden risk that comps aren't pricing in. Stress-test before assuming the spread holds.
- At $132,340/mo this rent would consume 2628% of the median local household income ($60k/yr) (locally 3614% of renters already pay >50% of income on rent) — very limited rent-growth headroom before tenants either downsize or default.
Questions for listing agent
- It's been on market 146 days. Have you received any prior offers? Is the seller open to a 12% concession, seller financing, or rate buy-down credit?
- Built in 1920 — when were the roof, HVAC, electrical panel, plumbing, and water heater last replaced?
- Why hasn't it sold? Are there any deal-killer items the seller is aware of (foundation, flood, title, zoning, code violations)?
- Is there a deadline driving the sale (1031 exchange, divorce, estate, relocation)? That informs how much negotiation room exists.
- Schools are D-rated, which usually means shorter tenancies and higher turnover. Who's the typical renter profile here, and what's been the actual vacancy rate?
- Crime grade is F in this area — have there been break-ins, vandalism, or insurance claims at this property in the last 3 years? What carrier currently insures it and at what premium?
- The area grade is low — what's the realistic commute time and amenity access for the typical tenant pool here? Any planned neighborhood developments (good or bad) we should know about?
- What's the average days-on-market for RENTAL listings here right now (not sales)? A rising rental-DOM trend means longer vacancies and softer asking-rent achievability than the comps imply.
CashFlowRE · CFR-74RF8181MHY3N0
· Data 5 days ago
cashflowre.app · 2026-05-29