 Multi-family
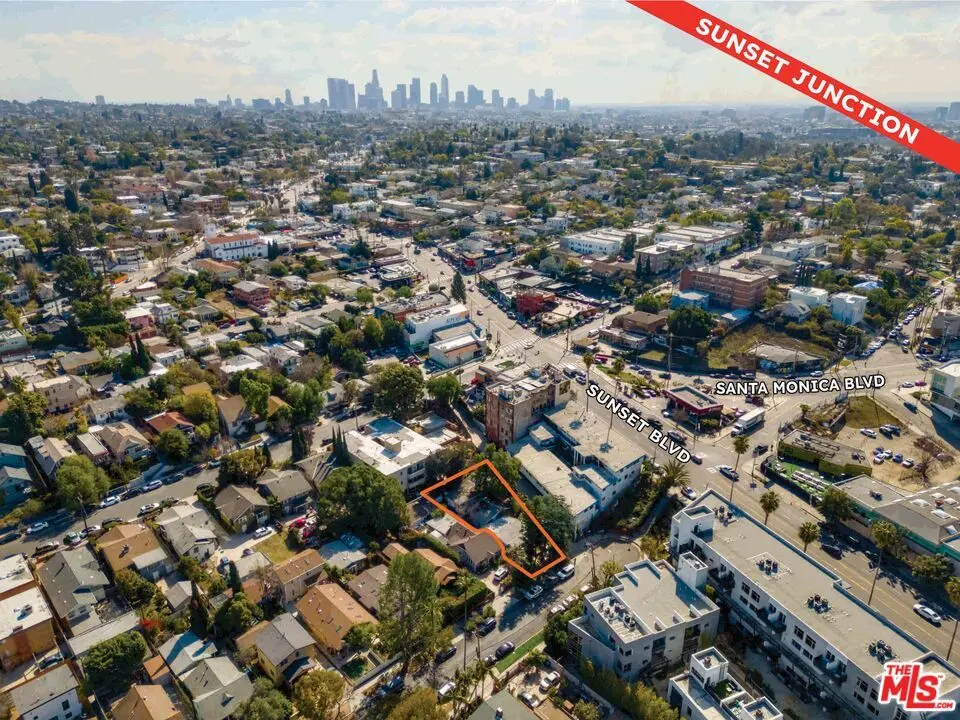
1108 Manzanita St · Los Angeles, CA
Flood risk 5/10 · Moderate
- FEMA flood zone
- X (unshaded)
- Chance of flooding over 30 yrs
- 0.24%
- Est. flood insurance / yr
- $507 – $1,088
Fire risk 1/10 · Minimal
- Est. fire insurance / yr
- $659 – $1,223
Heat risk 6/10 · Moderate
- Hot days now (above 92°F)
- 7 days/yr
- Hot days in 30 yrs
- 22 days/yr
Wind risk 1/10 · Minimal
- Chance of severe wind over 30 yrs
- —
Air-quality risk 5/10 · Moderate
- Unhealthy air days now
- 8 days/yr
- Unhealthy air days in 30 yrs
- 8 days/yr
Risk factors via First Street. Map © Google.
Why this score? — see what drove the D grade
The composite is a weighted blend of 9 inputs, each scored 0–100. Each bar is that input's sub-score; the figure is the points it added to the 100-point composite (weight × sub-score).
- Cash flow +15.0/30.0
- ARV discount +7.5/15.0
- 1% rule +5.0/10.0
- DSCR +5.0/10.0
- Schools +3.6/10.0
- Livability +3.4/5.0
- Rent growth +2.5/5.0
- Condition / age +2.5/5.0
- Appreciation +0.0/10.0
$2,350,000
🖨 Deal sheet 📄 Offer letter ✓ Due diligence
Multi-family units
County records classify this as Multi-Family (2-4 Unit). Listing-text estimate: 1 unit. estimate disagrees with records
Listing remarks MLS
Price Reduced! Outstanding 54-Unit 100% Affordable Housing Development Opportunity, RTI at COE in a highly desirable Silver Lake location near Sunset Junction. This prime project is located on a 7,688 SF lot and is designed as a five-story Type IIIB building under AB 1763 incentives, allowing unlimited density for affordable housing. With a total proposed floor area of 25,750 SF, the development includes 28 studio apartments and 26 one-bedroom units, all designated for affordable housing. The unit breakdown consists of 2 very low-income units, 40 low-income units, 11 moderate-income units, and 1 market-rate manager's unit. The design eliminates the need for parking, further reducing construction costs and ensuring long-term affordability. The residential units range from 280-460 SF, designed to maximize affordability while optimizing rental income per square foot. Located in the heart of Silver Lake, just minutes from Sunset Junction, this property offers an unmatched urban lifestyle with trendy cafes, boutique shops, and top-tier dining within walking distance. Its prime Transit-Priority Zone location ensures seamless connectivity, with multiple bus lines and metro access nearby. Additionally, the area boasts an exceptional Walk Score of 95, allowing residents to fully embrace a car-free lifestyle. With all entitlements and approvals secured, the project will be delivered in Ready-to-Issue status and will be delivered vacant at the close of escrow, providing an immediate and seamless path to development.
Key facts
- Silver lake location
- 7,688 sq ft lot
- Listed 146 days
Tags
Neighborhood map
What this means for you Summary
Snapshot
- This is a 3-bed/2.0-bath multifamily listed at $2.35M.
Deal economics
- At list price, monthly cash flow is $90k ($1.08M/yr) — positive.
- The deal already cash-flows at list — no discount required.
- Meets the 1% rule at list price ($132k rent vs $2.35M).
- Recommended offer: $2.07M (12.0% below list) — sets the bar for market timing.
- Cap rate 52.3% vs local median 2.1% in Los Angeles — top-decile yield for the area; either an underpriced asset or a hidden risk that comps aren't pricing in. Stress-test before assuming the spread holds.
Location & tenants
- Location reads 68/100 on livability (#273 in CA) — a middle-class / working-renter tenant base. Strengths: amenities A+, commute A+, employment B; Watch: health & safety C-, schools D+, crime F.
- Los Angeles Unified (urban): math 29% / reading 54% proficiency, ranked #223 of 517 in CA (top 43%) — families likely to look elsewhere, expect single-tenant / working-renter base with shorter leases; 67% free/reduced lunch — lower-income household profile, screen leases tightly.
- Market conditions: Rents flat; 76 active listings in the ZIP; 40 comparable units currently listed for rent nearby; rentals at typical pace (median 25d on market — plan ~3-4 weeks tenant-placement turnaround); 40% of comp listings sitting > 30 days — soft ceiling on asking rent; 19,697 units permitted in Los Angeles County in 2024 (9,426 in 5+ unit buildings).
- At $132,340/mo this rent would consume 2628% of the median local household income ($60k/yr) (locally 3614% of renters already pay >50% of income on rent) — very limited rent-growth headroom before tenants either downsize or default.
Forward outlook
- Local home prices are declining (-3.0%/yr); year-one equity from $16k of loan paydown is wiped out by about $70k of value loss. Plan a longer hold.
- Los Angeles County population projected at +9% by 2050 — modest demand growth; plan on rents tracking national, not racing it.
- At projected returns (-3.0% appreciation + 0.2% rent growth), your $658k cash investment doubles in ~1 year — after that, you're playing with house money.
Negotiation context
- It's been on market 146 days — a 12% lower offer ($2.07M) is reasonable based on typical stale-listing flexibility.
- 5 sale attempts since 7y ago with the ask held roughly flat each time — persistent listings suggest the price (not the market) is what's stuck; bring a comps-based counter.
- Current owner paid $1.10M; list at $2.35M implies a 114% gain — meaningful room to come down on a strong offer.
Risks & watch-outs
- Watch-outs: built in 1920 — expect roof / HVAC / electrical / plumbing capex.
- Climate carrying-cost: moderate flood risk; extreme-heat days projected 7→22/yr by 2055 (HVAC capex compounding) — expect insurance premiums to compound above CPI over the hold.
Questions for the listing agent
- It's been on market 146 days. Have you received any prior offers? Is the seller open to a 12% concession, seller financing, or rate buy-down credit?
- Built in 1920 — when were the roof, HVAC, electrical panel, plumbing, and water heater last replaced?
- Why hasn't it sold? Are there any deal-killer items the seller is aware of (foundation, flood, title, zoning, code violations)?
- Is there a deadline driving the sale (1031 exchange, divorce, estate, relocation)? That informs how much negotiation room exists.
- Schools are D-rated, which usually means shorter tenancies and higher turnover. Who's the typical renter profile here, and what's been the actual vacancy rate?
- Crime grade is F in this area — have there been break-ins, vandalism, or insurance claims at this property in the last 3 years? What carrier currently insures it and at what premium?
- The area grade is low — what's the realistic commute time and amenity access for the typical tenant pool here? Any planned neighborhood developments (good or bad) we should know about?
- What's the average days-on-market for RENTAL listings here right now (not sales)? A rising rental-DOM trend means longer vacancies and softer asking-rent achievability than the comps imply.
- What's the recent tenant-quality profile in this submarket — average credit score on applications, eviction rate, late-payment / NSF rate, and stable-employment percentage? A property-management company in the area should have these aggregated.
- How much new apartment / multifamily construction is in the pipeline within 1–3 miles? Heavy new supply (>2% of stock underway) typically softens rents 12–24 months out; light construction supports rent growth.
Investment metrics
- 1% rule
- 5.63% ✓
- Cap rate
- 52.27%
- Cash-on-cash
- 164.19%
- DSCR
- 8.31
- GRM
- 1.5
CMA / ARV
- ARV (median comp)
- $8,556,550,521
- List price
- $2,350,000
- Delta
- -99.97%
- Verdict
- UNDERPRICED
- Comps
- 1 within 2.0 mi
Show comp detail 2 sales within ~0.75 mi
| Address | Dist | Beds/Ba | Sqft | Sold | Price | $/sf | Match |
|---|---|---|---|---|---|---|---|
| 1248 Hyperion Ave | 0.21mi | 2/2.0 (-1) | 1,116 (-11%) | 8mo | $1,100,000 | $986 | 59 |
| 1118 N Virgil Ave | 0.35mi | 4/2.0 (+1) | 1,425 (+13%) | 12mo | $895,000 | $628 | 46 |
Match score weights: distance 35% · size 25% · config 20% · recency 20%. Top-matched comps best support the ARV.
Projected returns pro-forma
-3.0% appreciation · 0.19% rent growth · sell at horizon
- IRR
- —
- Equity multiple
- 8.58×
- Total profit
- $4,990,214
- Equity at exit
- $350,393
- IRR
- —
- Equity multiple
- 16.69×
- Total profit
- $10,320,864
- Equity at exit
- $203,185
Cash invested: $658,000 (down + closing). Projections, not guarantees.
Landlord ↔ Tenant lean methodology
- Overall (CITY)
- 0 Strongly Tenant-Friendly
- State California
- 18 Strongly Tenant-Friendly · D+13
- County
- — inherits STATE
- City Los Angeles
- 0 Strongly Tenant-Friendly · D+22
ZIP-level market 90029
- Rents YoY
- 0.2%
- Active inventory
- 76
- Price-to-rent
- 79.9×
Monthly cashflow live
- Estimated rent
- $132,340 high interval (Pro) →
- Mortgage (P&I)
- −$12,324
- Tax from tax record
- −$1,216 /mo · $14,595/yr
- Insurance
- −$979
- HOA
- −$0
- Vacancy / Maint / Mgmt
- −$27,791
- Net cashflow
- $90,030
Break-even live
54-unit breakdown (identical units grouped — click to expand)
| Units | Beds | Baths | Est. rent |
|---|---|---|---|
| 54× units | 0 | 0 | $132,354 |
| #1 | 0 | 0 | $2,451 |
| #2 | 0 | 0 | $2,451 |
| #3 | 0 | 0 | $2,451 |
| #4 | 0 | 0 | $2,451 |
| #5 | 0 | 0 | $2,451 |
| #6 | 0 | 0 | $2,451 |
| #7 | 0 | 0 | $2,451 |
| #8 | 0 | 0 | $2,451 |
| #9 | 0 | 0 | $2,451 |
| #10 | 0 | 0 | $2,451 |
| #11 | 0 | 0 | $2,451 |
| #12 | 0 | 0 | $2,451 |
| #13 | 0 | 0 | $2,451 |
| #14 | 0 | 0 | $2,451 |
| #15 | 0 | 0 | $2,451 |
| #16 | 0 | 0 | $2,451 |
| #17 | 0 | 0 | $2,451 |
| #18 | 0 | 0 | $2,451 |
| #19 | 0 | 0 | $2,451 |
| #20 | 0 | 0 | $2,451 |
| #21 | 0 | 0 | $2,451 |
| #22 | 0 | 0 | $2,451 |
| #23 | 0 | 0 | $2,451 |
| #24 | 0 | 0 | $2,451 |
| #25 | 0 | 0 | $2,451 |
| #26 | 0 | 0 | $2,451 |
| #27 | 0 | 0 | $2,451 |
| #28 | 0 | 0 | $2,451 |
| #29 | 0 | 0 | $2,451 |
| #30 | 0 | 0 | $2,451 |
| #31 | 0 | 0 | $2,451 |
| #32 | 0 | 0 | $2,451 |
| #33 | 0 | 0 | $2,451 |
| #34 | 0 | 0 | $2,451 |
| #35 | 0 | 0 | $2,451 |
| #36 | 0 | 0 | $2,451 |
| #37 | 0 | 0 | $2,451 |
| #38 | 0 | 0 | $2,451 |
| #39 | 0 | 0 | $2,451 |
| #40 | 0 | 0 | $2,451 |
| #41 | 0 | 0 | $2,451 |
| #42 | 0 | 0 | $2,451 |
| #43 | 0 | 0 | $2,451 |
| #44 | 0 | 0 | $2,451 |
| #45 | 0 | 0 | $2,451 |
| #46 | 0 | 0 | $2,451 |
| #47 | 0 | 0 | $2,451 |
| #48 | 0 | 0 | $2,451 |
| #49 | 0 | 0 | $2,451 |
| #50 | 0 | 0 | $2,451 |
| #51 | 0 | 0 | $2,451 |
| #52 | 0 | 0 | $2,451 |
| #53 | 0 | 0 | $2,451 |
| #54 | 0 | 0 | $2,451 |
| Total (54 units) | $132,340 | ||
UW: 25.0% down · 7.5% · 30yr · 1.5% tax · 5.0% vac · 8.0% maint · 8.0% mgmt
Financing live
Cash to close
- Down payment
- $587,500
- Closing costs
- $70,500
- Reserves months
- —
- Total cash needed
- —
Loan-product check · same deal, 3 products live
Conventional
25% down · 7.5% · 30yr
- Down + closing
- —
- Monthly P&I
- —
- Monthly cashflow
- —
- DSCR
- —
- Eligible?
- —
Personal DTI + credit; lowest rate.
DSCR
20% down · 8.5% · 30yr
- Down + closing
- —
- Monthly P&I
- —
- Monthly cashflow
- —
- DSCR
- —
- Eligible?
- —
No personal income docs; deal must DSCR.
Hard money
10% down · 12.0% · 12mo
- Down + closing
- —
- Monthly P&I
- —
- Monthly cashflow
- —
- DSCR
- —
- Eligible?
- —
Short-term bridge; refi at stabilization.
Rent comps 40 comps
| Address | Beds | Baths | Sqft | Rent | $/sqft | DOM | Units | Dist |
|---|---|---|---|---|---|---|---|---|
| 1185 Myra Ave Los Angeles, CA | 2.0 | 2.0 | 1045 | $3,163 | $3.03 | 7d | 1 | 0.12mi |
| 1185 Myra Ave Los Angeles, CA | 2.0 | 2.0 | 1045 | $3,163 | $3.03 | 24d | 1 | 0.12mi |
| 1205 Manzanita St Los Angeles, CA | 3.0 | 3.5 | 1672 | $6,400 | $3.83 | 24d | 1 | 0.14mi |
| 1171 Hyperion Ave Los Angeles, CA | 2.0 | 1.0 | 1056 | $6,500 | $6.16 | 12d | 1 | 0.15mi |
| 1221 Myra Ave Los Angeles, CA | 1.0–6.0 | 1.0–5.0 | 1248 | $4,535 | $3.63 | 1d | 6 | 0.16mi |
| 1232 Manzanita St Los Angeles, CA | 2.0 | 2.0 | 1003 | $3,950 | $3.94 | 24d | 1 | 0.18mi |
| 1118 N Hoover St Los Angeles, CA | 2.0 | 1.0 | 1100 | $4,800 | $4.36 | 43d | 1 | 0.22mi |
| 957 Manzanita St Los Angeles, CA | 3.0 | 2.5 | 1748 | $6,950 | $3.98 | 43d | 1 | 0.25mi |
| 1000 Myra Ave Los Angeles, CA | 3.0 | 2.5 | 1600 | $9,350 | $5.84 | 43d | 1 | 0.29mi |
| 3627 Crestmont Ave Los Angeles, CA | 4.0 | 3.0 | 1860 | $7,500 | $4.03 | 43d | 1 | 0.30mi |
| 4522 Lexington Ave Los Angeles, CA | 2.0 | 2.0 | 952 | $3,780 | $3.97 | 43d | 1 | 0.37mi |
| 1012 N Virgil Ave Unit 10145 Los Angeles, CA | 2.0 | 1.0 | 1000 | $3,000 | $3.00 | 24d | 1 | 0.38mi |
| 1332 Edgecliffe Dr Los Angeles, CA | 3.0 | 1.0 | 1482 | $7,500 | $5.06 | 43d | 1 | 0.40mi |
| 964 Lucile Ave Los Angeles, CA | 2.0 | 2.0 | 1103 | $5,450 | $4.94 | 20d | 1 | 0.43mi |
| 962 Lucile Ave Unit 1/2 Los Angeles, CA | 2.0 | 2.0 | 1103 | $5,450 | $4.94 | 22d | 1 | 0.43mi |
| 3429 Larissa Dr Los Angeles, CA | 3.0 | 3.0 | 1550 | $5,995 | $3.87 | 43d | 1 | 0.44mi |
| 3884 Clayton Ave Los Angeles, CA | 3.0 | 2.0 | 1860 | $6,200 | $3.33 | 43d | 1 | 0.45mi |
| 4575 Santa Monica Blvd Unit 304 Los Angeles, CA | 2.0 | 2.0 | 881 | $2,850 | $3.23 | 24d | 1 | 0.46mi |
| 3866 Udell Ct Los Angeles, CA | 3.0 | 3.0 | 1837 | $5,950 | $3.24 | 20d | 1 | 0.49mi |
| 1933 Griffith Park Blvd Los Angeles, CA | 3.0 | 3.5 | 1792 | $6,749 | $3.77 | 43d | 1 | 0.50mi |
| 1937 Griffith Park Blvd Los Angeles, CA | 3.0 | 3.5 | 1874 | $7,000 | $3.74 | 24d | 1 | 0.50mi |
| 1710 Redcliff St Los Angeles, CA | 2.0 | 1.0 | 1087 | $5,995 | $5.52 | 24d | 1 | 0.53mi |
| 872 Lucile Ave Unit A Los Angeles, CA | 3.0 | 3.0 | 1862 | $5,300 | $2.85 | 43d | 1 | 0.54mi |
| 967 N Madison Ave Unit 4506 Los Angeles, CA | 4.0 | 2.0 | 1300 | $3,400 | $2.62 | 3d | 1 | 0.55mi |
| 3236 Larissa Dr Los Angeles, CA | 2.0 | 2.0 | 1000 | $4,000 | $4.00 | 44d | 1 | 0.56mi |
| 2018 Griffith Park Blvd Los Angeles, CA | 2.0 | 2.0 | 1140 | $4,900 | $4.30 | 24d | 3 | 0.56mi |
| 2018 Griffith Park Blvd Los Angeles, CA | 2.0 | 2.0 | 1140 | $4,850 | $4.25 | 20d | 2 | 0.56mi |
| 4345 Burns Ave Los Angeles, CA | 2.0 | 2.0 | 1200 | $3,250 | $2.71 | 43d | 1 | 0.56mi |
| 4215 Camero Ave Los Angeles, CA | 2.0 | 2.0 | 910 | $3,500 | $3.85 | 14d | 1 | 0.56mi |
| 4031 Camero Ave Los Angeles, CA | 3.0 | 2.0 | 1451 | $7,500 | $5.17 | 43d | 1 | 0.57mi |
| 2018 Griffith Park Blvd #121 Los Angeles, CA | 2.0 | 2.0 | 1070 | $5,000 | $4.67 | 7d | 1 | 0.57mi |
| 4632 Santa Monica Blvd Los Angeles, CA | 1.0–2.0 | 1.0–2.0 | 818 | $3,650 | $4.46 | 3d | 15 | 0.57mi |
| 4531 Hollywood Blvd Los Angeles, CA | 2.0 | 2.0 | 985 | $4,010 | $4.07 | 43d | 1 | 0.58mi |
| 4531 Hollywood Blvd Los Angeles, CA | 3.0 | 2.0 | 1147 | $5,135 | $4.48 | 16d | 1 | 0.58mi |
| 734 Hyperion Ave Unit 1/2 Los Angeles, CA | 3.0 | 2.0 | 1098 | $3,255 | $2.96 | 43d | 1 | 0.60mi |
| 4427 Camero Ave Los Angeles, CA | 4.0 | 2.5 | 1300 | $4,950 | $3.81 | 20d | 1 | 0.64mi |
| 1975 Micheltorena St Los Angeles, CA | 3.0 | 3.0 | 1772 | $10,000 | $5.64 | 43d | 1 | 0.64mi |
| 1997 Lucile Ave Los Angeles, CA | 2.0 | 2.0 | 1288 | $4,840 | $3.76 | 19d | 1 | 0.64mi |
| 901 Micheltorena St Los Angeles, CA | 2.0 | 2.0 | 1200 | $6,499 | $5.42 | 24d | 1 | 0.64mi |
| 4433 Burns Ave Unit 1 Los Angeles, CA | 3.0 | 2.0 | 1246 | $3,300 | $2.65 | 4d | 1 | 0.65mi |
Listing history 22 events
-
2026-06-15days on market $2,350,000 Active 146 DOM
-
2026-06-13days on market $2,350,000 Active 144 DOM
-
2026-06-09days on market $2,350,000 Active 140 DOM
-
2026-06-08days on market $2,350,000 Active 139 DOM
-
2026-06-07days on market $2,350,000 Active 138 DOM
-
2026-06-04days on market $2,350,000 Active 135 DOM
-
2026-06-03days on market $2,350,000 Active 134 DOM
-
2026-06-02days on market $2,350,000 Active 133 DOM
-
2026-06-01days on market $2,350,000 Active 132 DOM
-
2026-05-31days on market $2,350,000 Active 131 DOM
-
2026-01-20$2,350,000 Active 1531-char remark
Show marketing remark (1531 chars)
Price Reduced! Outstanding 54-Unit 100% Affordable Housing Development Opportunity, RTI at COE in a highly desirable Silver Lake location near Sunset Junction. This prime project is located on a 7,688 SF lot and is designed as a five-story Type IIIB building under AB 1763 incentives, allowing unlimited density for affordable housing. With a total proposed floor area of 25,750 SF, the development includes 28 studio apartments and 26 one-bedroom units, all designated for affordable housing. The unit breakdown consists of 2 very low-income units, 40 low-income units, 11 moderate-income units, and 1 market-rate manager's unit. The design eliminates the need for parking, further reducing construction costs and ensuring long-term affordability. The residential units range from 280-460 SF, designed to maximize affordability while optimizing rental income per square foot. Located in the heart of Silver Lake, just minutes from Sunset Junction, this property offers an unmatched urban lifestyle with trendy cafes, boutique shops, and top-tier dining within walking distance. Its prime Transit-Priority Zone location ensures seamless connectivity, with multiple bus lines and metro access nearby. Additionally, the area boasts an exceptional Walk Score of 95, allowing residents to fully embrace a car-free lifestyle. With all entitlements and approvals secured, the project will be delivered in Ready-to-Issue status and will be delivered vacant at the close of escrow, providing an immediate and seamless path to development.
-
2025-09-24status Active
-
2025-06-25status Pending
-
2025-06-18historical Backup Offers Accepted
-
2022-12-07Active
-
2021-06-25soldstatus $1,100,000 Closed Sale
-
2021-04-26status Pending Sale
-
2021-04-16price $1,200,000
-
2020-07-24status Active
-
2020-07-24price $1,400,000
-
2020-06-03status Pending Sale
-
2019-09-20$1,600,000 Active
ⓘ Source: listings_history table (triggers on properties + properties_extension) + one-shot
backfill from property_details.listing_events for pre-trigger history.
Tax reassessment forecast CA · Resets to sale price
- Current annual tax
- $14,595 · $1,216/mo
- Projected year-2 tax
- $17,860 · $1,488/mo
- Expected delta
- +$3,265/yr (+$272/mo · 22.4%)
ⓘ Screening estimate from a state-policy table — verify with the county assessor before closing.
Climate risk First Street
- Flood 5/10 Major FEMA zone X (unshaded) · 24% chance over 30 yrs
- Wildfire 1/10 Low
- Heat 6/10 Major 7 d/yr ≥92°F today · 22 d/yr by 30 yrs out
- Wind 1/10 Low
- Air quality 5/10 Major 8 unhealthy d/yr today · 8 by 30 yrs out
Nearby sold comps map
Loading sold comps map…
Walkable amenities ~0.75 mi
Loading nearby amenities…
Taxation est. · year 1
- Rental income
- $1,588,080
- − Mortgage interest
- −$131,637
- − Property taxes
- −$14,595
- − Insurance
- −$11,750
- − Repairs & maintenance
- −$127,046
- − Management
- −$127,046
- − Depreciation
- −$68,364
- Taxable income
- $1,107,642
- Est. tax owed @ 24.0%
- −$265,834
- After-tax cash flow
- $814,521/yr
For passive investors: Depreciation is non-cash, so a rental often shows a tax loss while cash-flowing — sheltering income. Rental losses are passive: they offset passive income freely, and up to $25,000/yr can offset ordinary (W-2) income if you actively participate and your MAGI is under $100k (phasing out to $0 by $150k); unused losses carry forward. On sale, claimed depreciation is recaptured at up to 25%, and gains may owe capital-gains tax (a 1031 exchange can defer both). Figures are a year-1 estimate at your 24.0% rate — not tax advice; consult a CPA.
Schools (NCES district)
- District
- Los Angeles Unified
- NCES district ID
- 0622710
- Math proficiency
- 29% ▼ -4.00%
- Reading proficiency
- 54% ▲ 10.00%
- Median HH income
- $50,403
- Composite
- 35.67/100
- National rank
- #4875
- State rank
- #223 of 517 in CA
Livability — Los Angeles
- Score
- 68/100
- State rank
- #273
- US rank
- #9237
Category grades
Schools grade is shown separately in the Schools card above.
Census & demographics
- Census place
- Los Angeles, CA
- County
- Los Angeles County · 9,444,647 people
- City population
- 3,838,149
- Metro
- Los Angeles-Long Beach-Anaheim, CA
- Population (ZIP)
- 33,303
- Household income
- $60,440
- Rent vs Own
- Severe rent burden
- 3614.0
Population outlook (Los Angeles County) Hauer SSP2
- Today (2025)
- 10,940,515 people
- By 2030
- 11,256,481 · +2.9%
- By 2040
- 11,729,929 · +7.2%
- By 2050
- 11,948,407 · +9.2%
- By 2075
- 11,818,114 · +8.0%
- By 2100
- 10,842,928 · -0.9%
Race, ethnicity, and origin ACS 2023
- Neighborhood character
- Diverse neighborhood (Simpson 0.66)
- Race & ethnicity
- Hispanic / Latino 49% White 27% Asian 17% Two or more races 10% Black 4% Native American 1%
- Hispanic origin (detail)
- Mexican 19%
- Common ancestry
- Scotch-Irish 1% Romanian 1% Slovak 1%
- Foreign-born
- 49% · Canada, China, South Korea
- Languages at home
- 33% English-only · Spanish 45% Tagalog/Filipino 9% Other Indo-European 6%
Political lean MEDSL · Los Angeles
- 2024 margin
- Solid D (+32.9) · D 64.8% · R 31.9% · Other 3.3%
- 2008→2024 swing
- -7.4pp toward R · 2008: 40.4pp · 2024: 32.9pp
- All cycles
- 2024: D+32.9 2020: D+44.2 2016: D+48.0 2012: D+40.0 2008: D+40.4
Not yet ingested
- Civics
- —
Market trends
- HPI YoY
- ▼ -292.27%
- Current HPI
- 451.0593
- Rent YoY
- ▲ 0.19%
- Metro
- Los Angeles-Long Beach-Anaheim, CA
- State GDP YoY
- ▲ 3.21%
- F500 in state
- 116
Industry mix (Fortune 500 HQ in CA)
| Industry | F500 HQs | Revenue |
|---|---|---|
| Technology | 27 | $1,492B |
|
||
| Financial Services | 3 | $174B |
|
||
| Retail | 3 | $44B |
|
||
| Insurance | 3 | $26B |
|
||
| Media / Entertainment | 2 | $115B |
|
||
| Pharmaceuticals / Biotech | 2 | $62B |
|
||
Price history
+46.9% since first listed12 events — show timeline
- 2026-01-20 Listed $2,350,000 TheMLS
- 2025-09-24 Relisted — TheMLS
- 2025-06-25 Pending — TheMLS
- 2025-06-18 Contingent — TheMLS
- 2022-12-07 Listed — TheMLS
- 2021-06-25 Sold (MLS) $1,100,000 CRMLS
- 2021-04-26 Pending — CRMLS
- 2021-04-16 Price Changed $1,200,000 CRMLS
- 2020-07-24 Relisted — CRMLS
- 2020-07-24 Price Changed $1,400,000 CRMLS
- 2020-06-03 Pending — CRMLS
- 2019-09-20 Listed $1,600,000 CRMLS
Property tax history
+17.4%/yrLatest (2025): $14,595 · +1.5% YoY. Source: county tax records.
Cash-flow waterfall
monthlySold comps — $/sqft
last 12 mo · ≤1 miLoading sold comps…