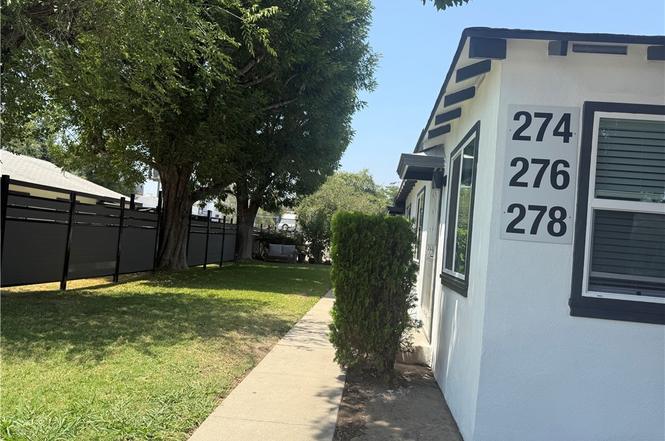
274 E Kingman St
San Bernardino, CA 92410
$669,400F
9 bd · 9.0 ba ·
1,452 sqft ·
Built 1955
· MultiFamily
· Active
· 3 DOM
Cashflow @ list (25.0% down · 7.5%)
Estimated rent
$4,317/mo
Mortgage (P&I)
−$3,510
Tax + insurance
−$1,116
HOA
−$0
Vac / Maint / Mgmt
−$907
Net cashflow
$-1,216/mo
Annual
$-14,588/yr
Cap rate
4.11%
Cash-on-cash
-7.78%
DSCR
0.65
1% rule
0.64%
Cash to close
$187,432
Investor read
- This is a 3 × 1-bed/1.0-bath units multifamily listed at $669k.
- At list price, monthly cash flow is $-1k ($-15k/yr) — negative. Per door: $-405/mo.
- To cash-flow at today's rent, offer at most $493k (26.3% below list).
- To meet the 1% rule (rent ≥ 1% of price), the offer needs to be $432k (35.5% below list).
- Only 3 days on market — expect competitive offers; lowballing is unlikely to land.
- Recommended offer: $432k (35.5% below list) — sets the bar for 1% rule.
- Local home prices are declining (-3.0%/yr); year-one equity from $5k of loan paydown is wiped out by about $20k of value loss. Plan a longer hold.
- Location reads 59/100 on livability (#661 in CA) — a working-class tenant base; expect higher turnover. Strengths: commute A+, housing A; Watch: employment D, crime F, cost of living F.
- San Bernardino City Unified (urban): math 27% / reading 40% proficiency, ranked #959 of 1,400 in CA (top 68%) — families likely to look elsewhere, expect single-tenant / working-renter base with shorter leases; 81% free/reduced lunch — lower-income household profile, screen leases tightly.
- Zoned schools: Captain Leland Norton Elementary (472 students, 96% FRL); Arrowview Middle (968 students, 97% FRL); Indian Springs High (1,901 students, 92% FRL).
- Watch-outs: built in 1955 — expect roof / HVAC / electrical / plumbing capex.
- Market conditions: Rents rising fast (+5.5%/yr); 88 active listings in the ZIP; 5,458 units permitted in San Bernardino County in 2024 (1,500 in 5+ unit buildings).
- San Bernardino County population projected at +15% by 2050 — modest demand growth; plan on rents tracking national, not racing it.
- Current owner paid $415k; list at $669k implies a 61% gain — meaningful room to come down on a strong offer.
- Climate carrying-cost: extreme-heat days projected 7→20/yr by 2055 (HVAC capex compounding) — expect insurance premiums to compound above CPI over the hold.
- At $4,317/mo this rent would consume 96% of the median local household income ($54k/yr) (locally 2569% of renters already pay >50% of income on rent) — very limited rent-growth headroom before tenants either downsize or default.
Questions for listing agent
- What do current leases actually rent for vs. the listed asking? Can we see a recent rent roll and the last 12 months of T-12 income?
- Can we see the unit-by-unit rent roll, current vacancy, and any below-market leases? What's the average tenancy length?
- What capital expenditures (roof, boiler, parking lot, exteriors) have been made in the last 5 years, and what's planned in the next 2?
- Built in 1955 — when were the roof, HVAC, electrical panel, plumbing, and water heater last replaced?
- Is there a deadline driving the sale (1031 exchange, divorce, estate, relocation)? That informs how much negotiation room exists.
- Schools are D-rated, which usually means shorter tenancies and higher turnover. Who's the typical renter profile here, and what's been the actual vacancy rate?
- Crime grade is F in this area — have there been break-ins, vandalism, or insurance claims at this property in the last 3 years? What carrier currently insures it and at what premium?
- The area grade is low — what's the realistic commute time and amenity access for the typical tenant pool here? Any planned neighborhood developments (good or bad) we should know about?
CashFlowRE · CFR-766YEBCYX1B6KD
· Data 19 h ago
cashflowre.app · 2026-05-29