 Triplex
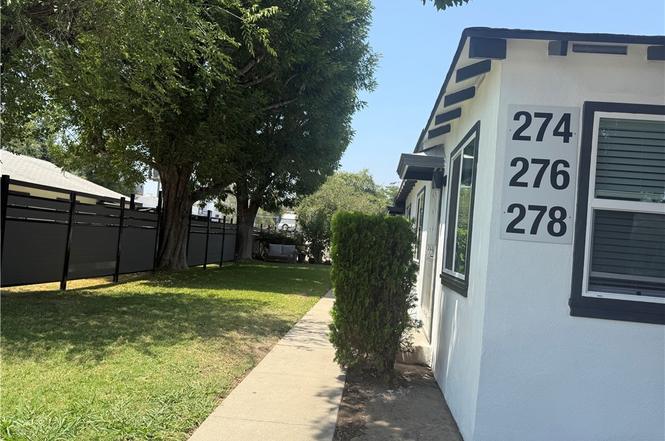
274 E Kingman St · San Bernardino, CA
Flood risk 4/10 · Minor
- FEMA flood zone
- X (unshaded)
- Chance of flooding over 30 yrs
- 0.2%
- Est. flood insurance / yr
- $507 – $1,088
Fire risk 1/10 · Minimal
- Est. fire insurance / yr
- $659 – $1,223
Heat risk 8/10 · Major
- Hot days now (above 102°F)
- 7 days/yr
- Hot days in 30 yrs
- 20 days/yr
Wind risk 1/10 · Minimal
- Chance of severe wind over 30 yrs
- —
Air-quality risk 10/10 · Severe
- Unhealthy air days now
- 25 days/yr
- Unhealthy air days in 30 yrs
- 31 days/yr
Risk factors via First Street. Map © Google.
Why this score? — see what drove the F grade
The composite is a weighted blend of 9 inputs, each scored 0–100. Each bar is that input's sub-score; the figure is the points it added to the 100-point composite (weight × sub-score).
- ARV discount +7.5/15.0
- Cash flow +6.2/30.0
- Rent growth +3.9/5.0
- Schools +3.1/10.0
- Livability +3.0/5.0
- Condition / age +2.5/5.0
- 1% rule +1.4/10.0
- DSCR +0.5/10.0
- Appreciation +0.0/10.0
$669,400
🖨 Deal sheet (PDF) 📄 Offer letter ✓ Due diligence
Multi-family units
County records classify this as Multi-Family (2-4 Unit). Listing-text estimate: 3 units. confirmed
Listing remarks
EXCELLENT INVESTMENT OPPORTUNITY! JUST MINUTES FROM DOWNTOWN SAN BERNARDINO WITH EASY ACCESS TO SHOPING, RESTAURANTS, SCHOOLS, PUBLIC TRANSPORTATION, GOVERNMENT OFFICES, AND MAJOR FREEWAYS. REMODELED TRIPLEX FEATURING THREE 1-BEDROOM, 1-BATH UNITS. TWO UNITS ARE CURRENTLY LEASED AT $1600.00 PER MONTH EACH PROVIDING IMMEDIATE RENTAL INCOME. THE THIRD UNIT IS PROFESSIONALLY STAGED, AND AVAILABLE FOR SHOWINGS, MAKING IT IDEAL FOR AN OWNER-OCCUPANT OR AN INVESTOR SEEKING TO LEASE AT CURRENT MARKET RENTS. PROPERTY HAS BEEN UPDATED WITH NEW FLORING, FRESH INTERIOR AND EXTERIOR PAINT, UPDATED KITCHENS AND ATTRACTIVE FINISHES THROUGHOUT, ALL NEW TILE BATH WITH NEW WINDOWS, NEW INTERIOR DOORS, THE L
Key facts
- New flooring
- Updated kitchens
- Fresh interior paint
Tags
Property features AI
Finance
- Other: Parcel number available
- Financial info: Gross scheduled income: $57,600; Total actual rent reported: $3,200; Example unit rent: $1,600 (unit is unfurnished); Two of three units are currently leased; Tenant pays gas and electricity
Exterior
- Parking: Six garage spaces; Three carport spaces; Nine total parking spaces; One unit-level listing indicates 3 garage spaces for that unit
- Utilities: Public sewer; District/public water; Three separate electric meters; Three separate gas meters; One separate water meter
- Home design: Multifamily property with 3 total units; Single-story; No accessory dwelling unit (ADU)
- Construction: One building; Total building area listed as 1,500
- Exterior features: No pool; Community park nearby; Lot features: 2–5 units per acre
Interior
- Bedrooms: Three 3-bedroom units total (unit-level details available)
- Bathrooms: Each 3-bedroom unit has 3 full bathrooms
- Heating & cooling: Wall heaters
- Interior features: One-level home; Attached property; Two or more common walls; Entry at ground level
- Laundry & utility: Inside laundry; Laundry available on-site
Neighborhood map
What this means for you Summary
Snapshot
- This is a 3 × 1-bed/1.0-bath units multifamily listed at $669k.
Deal economics
- At list price, monthly cash flow is $-1k ($-15k/yr) — negative. Per door: $-405/mo.
- To cash-flow at today's rent, offer at most $493k (26.3% below list).
- To meet the 1% rule (rent ≥ 1% of price), the offer needs to be $432k (35.5% below list).
- Recommended offer: $432k (35.5% below list) — sets the bar for 1% rule.
Location & tenants
- Location reads 59/100 on livability (#661 in CA) — a working-class tenant base; expect higher turnover. Strengths: commute A+, housing A; Watch: employment D, crime F, cost of living F.
- San Bernardino City Unified (urban): math 27% / reading 40% proficiency, ranked #959 of 1,400 in CA (top 68%) — families likely to look elsewhere, expect single-tenant / working-renter base with shorter leases; 81% free/reduced lunch — lower-income household profile, screen leases tightly.
- Zoned schools: Captain Leland Norton Elementary (472 students, 96% FRL); Arrowview Middle (968 students, 97% FRL); Indian Springs High (1,901 students, 92% FRL).
- Market conditions: Rents rising fast (+5.5%/yr); 88 active listings in the ZIP; 5,458 units permitted in San Bernardino County in 2024 (1,500 in 5+ unit buildings).
- At $4,317/mo this rent would consume 96% of the median local household income ($54k/yr) (locally 2569% of renters already pay >50% of income on rent) — very limited rent-growth headroom before tenants either downsize or default.
Forward outlook
- Local home prices are declining (-3.0%/yr); year-one equity from $5k of loan paydown is wiped out by about $20k of value loss. Plan a longer hold.
- San Bernardino County population projected at +15% by 2050 — modest demand growth; plan on rents tracking national, not racing it.
Negotiation context
- Only 3 days on market — expect competitive offers; lowballing is unlikely to land.
- Current owner paid $415k; list at $669k implies a 61% gain — meaningful room to come down on a strong offer.
Risks & watch-outs
- Watch-outs: built in 1955 — expect roof / HVAC / electrical / plumbing capex.
- Climate carrying-cost: extreme-heat days projected 7→20/yr by 2055 (HVAC capex compounding) — expect insurance premiums to compound above CPI over the hold.
Questions for the listing agent
- What do current leases actually rent for vs. the listed asking? Can we see a recent rent roll and the last 12 months of T-12 income?
- Can we see the unit-by-unit rent roll, current vacancy, and any below-market leases? What's the average tenancy length?
- What capital expenditures (roof, boiler, parking lot, exteriors) have been made in the last 5 years, and what's planned in the next 2?
- Built in 1955 — when were the roof, HVAC, electrical panel, plumbing, and water heater last replaced?
- Is there a deadline driving the sale (1031 exchange, divorce, estate, relocation)? That informs how much negotiation room exists.
- Schools are D-rated, which usually means shorter tenancies and higher turnover. Who's the typical renter profile here, and what's been the actual vacancy rate?
- Crime grade is F in this area — have there been break-ins, vandalism, or insurance claims at this property in the last 3 years? What carrier currently insures it and at what premium?
- The area grade is low — what's the realistic commute time and amenity access for the typical tenant pool here? Any planned neighborhood developments (good or bad) we should know about?
- What's the average days-on-market for RENTAL listings here right now (not sales)? A rising rental-DOM trend means longer vacancies and softer asking-rent achievability than the comps imply.
- What's the recent tenant-quality profile in this submarket — average credit score on applications, eviction rate, late-payment / NSF rate, and stable-employment percentage? A property-management company in the area should have these aggregated.
- How much new apartment / multifamily construction is in the pipeline within 1–3 miles? Heavy new supply (>2% of stock underway) typically softens rents 12–24 months out; light construction supports rent growth.
Investment metrics
- 1% rule
- 0.64% ✗
- Cap rate
- 4.11%
- Cash-on-cash
- -7.78%
- DSCR
- 0.65
- GRM
- 12.9
CMA / ARV
No comps found within radius.
Projected returns pro-forma
-3.0% appreciation · 5.5% rent growth · sell at horizon
- IRR
- -27.2%
- Equity multiple
- 0.07×
- Total profit
- $-174,702
- Equity at exit
- $99,810
- IRR
- -18.1%
- Equity multiple
- -0.09×
- Total profit
- $-203,486
- Equity at exit
- $57,877
Cash invested: $187,432 (down + closing). Projections, not guarantees.
Landlord ↔ Tenant lean methodology
- Overall (STATE)
- 18 Strongly Tenant-Friendly
- State California
- 18 Strongly Tenant-Friendly · D+13
- County
- — inherits STATE
- City
- — inherits STATE
ZIP-level market 92410
- Home prices YoY
- -9.7%
- Rents YoY
- 5.5%
- Active inventory
- 88
- Price-to-rent
- 38.8×
Monthly cashflow live
- Estimated rent
- $4,317 medium interval (Pro) →
- Mortgage (P&I)
- −$3,510
- Tax est. 1.5%
- −$837 /mo · $10,041/yr
- Insurance
- −$279
- HOA
- −$0
- Vacancy / Maint / Mgmt
- −$907
- Net cashflow
- $-1,216
Break-even live
Sensitivity live
| Price | -10% $-753 | -5% $-984 | +0% $-1,216 | +5% $-1,447 | +10% $-1,678 |
|---|---|---|---|---|---|
| Rent | -10% $-1,557 | -5% $-1,386 | +0% $-1,216 | +5% $-1,045 | +10% $-875 |
| Rate | -1.0pp $-879 | -0.5pp $-1,045 | base $-1,216 | +0.5pp $-1,389 | +1.0pp $-1,566 |
3-unit breakdown (identical units grouped — click to expand)
| Units | Beds | Baths | Est. rent |
|---|---|---|---|
| 3× units | 1 | 1 | $4,317 |
| #1 | 1 | 1 | $1,439 |
| #2 | 1 | 1 | $1,439 |
| #3 | 1 | 1 | $1,439 |
| Total (3 units) | $4,317 | ||
UW: 25.0% down · 7.5% · 30yr · 1.5% tax · 5.0% vac · 8.0% maint · 8.0% mgmt
Financing live
Cash to close
- Down payment
- $167,350
- Closing costs
- $20,082
- Reserves months
- —
- Total cash needed
- —
Loan-product check · same deal, 3 products live
Conventional
25% down · 7.5% · 30yr
- Down + closing
- —
- Monthly P&I
- —
- Monthly cashflow
- —
- DSCR
- —
- Eligible?
- —
Personal DTI + credit; lowest rate.
DSCR
20% down · 8.5% · 30yr
- Down + closing
- —
- Monthly P&I
- —
- Monthly cashflow
- —
- DSCR
- —
- Eligible?
- —
No personal income docs; deal must DSCR.
Hard money
10% down · 12.0% · 12mo
- Down + closing
- —
- Monthly P&I
- —
- Monthly cashflow
- —
- DSCR
- —
- Eligible?
- —
Short-term bridge; refi at stabilization.
Listing history 3 events
-
2026-06-21days on market $669,400 Active 3 DOM
-
2026-06-19remarks 699-char remark
-
2026-06-19$669,400 Active 1 DOM
ⓘ Source: listings_history table (triggers on properties + properties_extension) + one-shot
backfill from property_details.listing_events for pre-trigger history.
Climate risk First Street
- Flood 4/10 Moderate FEMA zone X (unshaded) · 20% chance over 30 yrs
- Wildfire 1/10 Low
- Heat 8/10 Severe 7 d/yr ≥102°F today · 20 d/yr by 30 yrs out
- Wind 1/10 Low
- Air quality 10/10 Extreme 25 unhealthy d/yr today · 31 by 30 yrs out
Nearby sold comps map
Loading sold comps map…
Walkable amenities ~0.75 mi
Loading nearby amenities…
Taxation est. · year 1
- Rental income
- $51,804
- − Mortgage interest
- −$37,497
- − Property taxes
- −$10,041
- − Insurance
- −$3,347
- − Repairs & maintenance
- −$4,144
- − Management
- −$4,144
- − Depreciation
- −$19,473
- Taxable loss
- −$26,843
- Est. tax savings @ 24.0%
- +$6,442
- After-tax cash flow
- $-8,145/yr
For passive investors: Depreciation is non-cash, so a rental often shows a tax loss while cash-flowing — sheltering income. Rental losses are passive: they offset passive income freely, and up to $25,000/yr can offset ordinary (W-2) income if you actively participate and your MAGI is under $100k (phasing out to $0 by $150k); unused losses carry forward. On sale, claimed depreciation is recaptured at up to 25%, and gains may owe capital-gains tax (a 1031 exchange can defer both). Figures are a year-1 estimate at your 24.0% rate — not tax advice; consult a CPA.
Schools (NCES district)
- District
- San Bernardino City Unified
- NCES district ID
- 0634170
- Math proficiency
- 27% ▲ 1.00%
- Reading proficiency
- 40% ▬ 0.00%
- Median HH income
- $39,758
- Composite
- 30.8/100
- National rank
- #11385
- State rank
- #959 of 1400 in CA
Livability — San Bernardino
- Score
- 59/100
- State rank
- #661
- US rank
- #20479
Category grades
Schools grade is shown separately in the Schools card above.
Census & demographics
- Census place
- San Bernardino, CA
- County
- San Bernardino County · 2,030,291 people
- City population
- 255,614
- Metro
- Riverside-San Bernardino-Ontario, CA
- Population (ZIP)
- 47,869
- Household income
- $54,181
- Rent vs Own
- Severe rent burden
- 2569.0
Population outlook (San Bernardino County) Hauer SSP2
- Today (2025)
- 2,300,329 people
- By 2030
- 2,378,907 · +3.4%
- By 2040
- 2,523,137 · +9.7%
- By 2050
- 2,642,388 · +14.9%
- By 2075
- 2,880,769 · +25.2%
- By 2100
- 2,909,436 · +26.5%
Race, ethnicity, and origin ACS 2023
- Neighborhood character
- Predominantly Hispanic (80%)
- Race & ethnicity
- Hispanic / Latino 80% Two or more races 12% Black 8% White 7% Asian 3%
- Hispanic origin (detail)
- Mexican 70%
- Common ancestry
- Romanian 0%
- Foreign-born
- 29% · Canada, Vietnam, Jamaica
- Languages at home
- 32% English-only · Spanish 65% Vietnamese 1%
Political lean MEDSL · San Bernardino
- 2024 margin
- Toss-up / Even · D 47.5% · R 49.7% · Other 2.8%
- 2008→2024 swing
- -8.5pp toward R · 2008: 6.3pp · 2024: -2.1pp
- All cycles
- 2024: R+2.1 2020: D+10.7 2016: D+9.8 2012: D+5.4 2008: D+6.3
Not yet ingested
- Civics
- —
Market trends
- HPI YoY
- ▼ -54.39%
- Current HPI
- 504.0299
- Rent YoY
- ▲ 5.50%
- Metro
- Riverside-San Bernardino-Ontario, CA
- State GDP YoY
- ▲ 3.21%
- F500 in state
- 116
Industry mix (Fortune 500 HQ in CA)
| Industry | F500 HQs | Revenue |
|---|---|---|
| Technology | 27 | $1,492B |
|
||
| Financial Services | 3 | $174B |
|
||
| Retail | 3 | $44B |
|
||
| Insurance | 3 | $26B |
|
||
| Media / Entertainment | 2 | $115B |
|
||
| Pharmaceuticals / Biotech | 2 | $62B |
|
||
Price history
+61.3% since first listed2 events — show timeline
- 2026-06-18 Listed $669,400 CRMLS
- 2026-01-09 Sold (Public Records) $415,000 Public Records
Property tax history
+3.5%/yrLatest (2025): $633 · +2.3% YoY. Source: county tax records.
Cash-flow waterfall
monthlySold comps — $/sqft
last 12 mo · ≤1 miLoading sold comps…