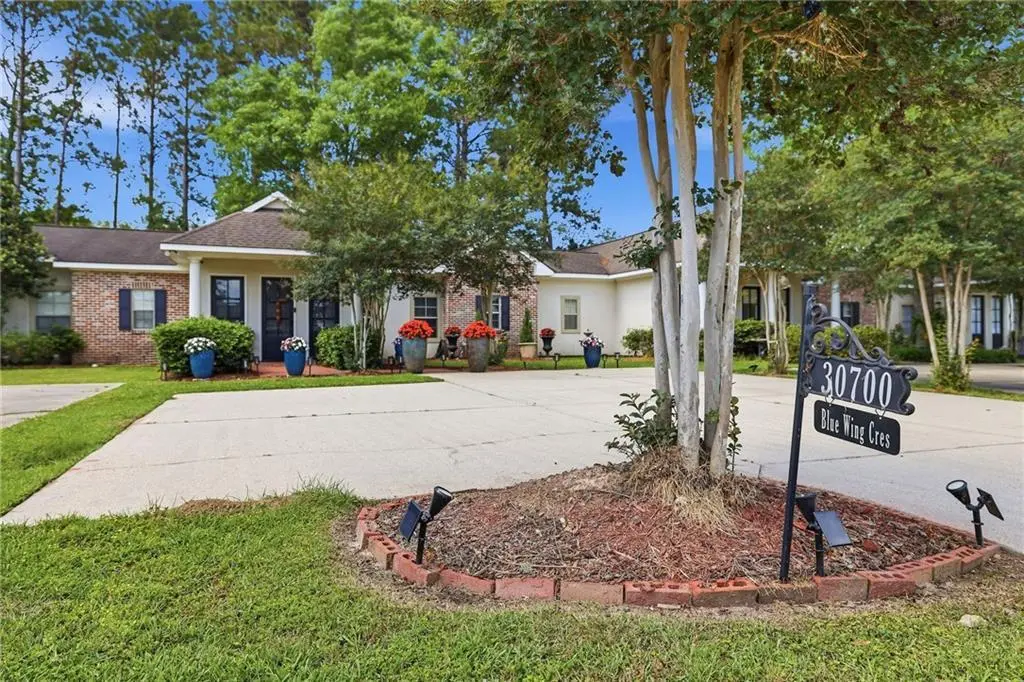
30700 Blue Wing Cres
Springfield, LA 70462
$204,900C-
2 bd · 2.0 ba ·
1,268 sqft ·
Built 2007
· SingleFamily
· Pending
· 4 DOM
Cashflow @ list (25.0% down · 7.5%)
Estimated rent
$1,813/mo
Mortgage (P&I)
−$1,075
Tax + insurance
−$364
HOA
−$83
Vac / Maint / Mgmt
−$381
Net cashflow
$-90/mo
Annual
$-1,079/yr
Cap rate
6.50%
Cash-on-cash
0.74%
DSCR
1.03
1% rule
0.88%
Cash to close
$57,372
Investor read
- This is a 2-bed/2.0-bath single-family listed at $205k.
- At list price, monthly cash flow is $-90 ($-1k/yr) — negative.
- To cash-flow at today's rent, offer at most $189k (7.8% below list).
- To meet the 1% rule (rent ≥ 1% of price), the offer needs to be $181k (11.5% below list).
- Only 4 days on market — expect competitive offers; lowballing is unlikely to land.
- Recommended offer: $181k (11.5% below list) — sets the bar for 1% rule.
- In year one you build about $22k of equity ($1k loan paydown + $20k appreciation (10.0% local appreciation)).
- Location reads 62/100 on livability (#218 in LA) — a middle-class / working-renter tenant base. Strengths: cost of living A+, housing A+, schools B+; Watch: employment C-, health & safety C-, crime F.
- Livingston Parish (suburban): math 40% / reading 52% proficiency, ranked #13 of 98 in LA (top 13%) — families likely to look elsewhere, expect single-tenant / working-renter base with shorter leases.
- Watch-outs: flood insurance adds $125/mo.
- Market conditions: 214 active listings in the ZIP; 2 comparable units currently listed for rent nearby; 794 units permitted in Livingston Parish in 2024 (99 in 5+ unit buildings).
- Livingston County population projected at +27% by 2050 — long-run rental-demand tailwind backs the buy-and-hold thesis.
- 8 sale attempts since 8y ago with the ask held roughly flat each time — persistent listings suggest the price (not the market) is what's stuck; bring a comps-based counter.
- By year 2, paydown + projected appreciation supports a ~$35k cash-out refi (75% LTV) — recoverable capital for the next deal without selling this one.
- Climate carrying-cost: in FEMA flood zone A (mandatory federal flood insurance); severe wind risk, 99% chance of damaging wind over 30y; extreme-heat days projected 7→22/yr by 2055 (HVAC capex compounding) — expect insurance premiums to compound above CPI over the hold.
- Cap rate 6.5% vs local median 4.4% in Springfield — top-decile yield for the area; either an underpriced asset or a hidden risk that comps aren't pricing in. Stress-test before assuming the spread holds.
Questions for listing agent
- What do current leases actually rent for vs. the listed asking? Can we see a recent rent roll and the last 12 months of T-12 income?
- What's the actual annual flood-insurance premium (NFIP or private), and is the property in a SFHA with mandatory coverage?
- What does the HOA fee cover, when was the last increase, and are there any pending special assessments or reserve-fund shortfalls?
- Is there a deadline driving the sale (1031 exchange, divorce, estate, relocation)? That informs how much negotiation room exists.
- Schools are B-rated — typically a magnet for longer-tenancy family renters. What's the average tenant stay here, and is there a school-zone premium baked into asking?
- Crime grade is F in this area — have there been break-ins, vandalism, or insurance claims at this property in the last 3 years? What carrier currently insures it and at what premium?
- What's the average days-on-market for RENTAL listings here right now (not sales)? A rising rental-DOM trend means longer vacancies and softer asking-rent achievability than the comps imply.
- What's the recent tenant-quality profile in this submarket — average credit score on applications, eviction rate, late-payment / NSF rate, and stable-employment percentage? A property-management company in the area should have these aggregated.
CashFlowRE · CFR-77ENBJA2MESM9A
· Data 3 weeks ago
cashflowre.app · 2026-05-29