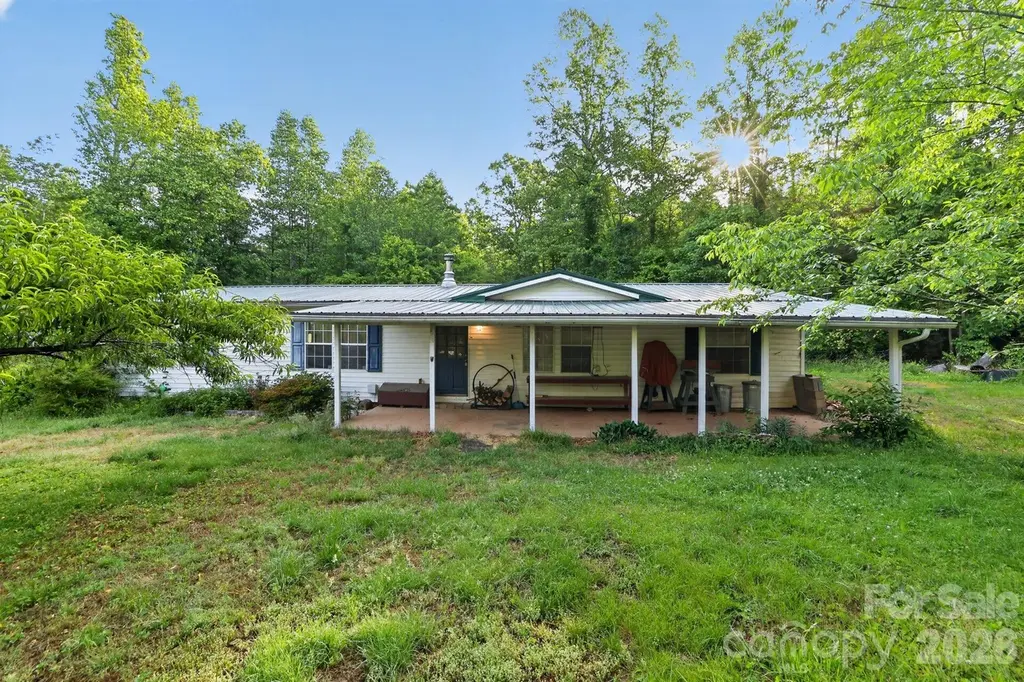
628 Grassy Knob Rd
Lake Lure, NC 28139
$159,000C+
3 bd · 2.0 ba ·
1,620 sqft ·
Built 1995
· Manufactured
· Active
· 32 DOM
Cashflow @ list (25.0% down · 7.5%)
Estimated rent
$1,794/mo
Mortgage (P&I)
−$834
Tax + insurance
−$151
HOA
−$0
Vac / Maint / Mgmt
−$377
Net cashflow
$432/mo
Annual
$5,188/yr
Cap rate
9.56%
Cash-on-cash
11.65%
DSCR
1.52
1% rule
1.13%
Cash to close
$44,520
Investor read
- This is a 3-bed/2.0-bath manufactured listed at $159k.
- At list price, monthly cash flow is $432 ($5k/yr) — positive.
- The deal already cash-flows at list — no discount required.
- Meets the 1% rule at list price ($2k rent vs $159k).
- It's been on market 32 days — a 3% lower offer ($154k) is reasonable based on typical stale-listing flexibility.
- Recommended offer: $154k (3.0% below list) — sets the bar for market timing.
- Local home prices are declining (-3.0%/yr); year-one equity from $1k of loan paydown is wiped out by about $5k of value loss. Plan a longer hold.
- Location reads 64/100 on livability (#351 in NC) — a middle-class / working-renter tenant base. Strengths: crime A+; Watch: cost of living D+, amenities F, commute F.
- Rutherford County Schools (rural): math 43% / reading 44% proficiency, ranked #98 of 178 in NC (top 55%) — families likely to look elsewhere, expect single-tenant / working-renter base with shorter leases; 60% free/reduced lunch — lower-income household profile, screen leases tightly.
- Zoned schools: Pinnacle Elementary School (math 32% / reading 37%, grade F, #835 of 1,410 statewide, top 62%, 234 students, 99% FRL); R-S Central High School (math 62% / reading 42%, grade D+, #292 of 535 statewide, top 56%, 758 students, 100% FRL) — zoned schools average 99% FRL vs 60% district-wide (39 pts higher); higher-poverty schools than district average — tighter screening recommended.
- Market conditions: 312 active listings in the ZIP; 193 units permitted in Rutherford County in 2024 (0 in 5+ unit buildings).
- Rutherford County population projected at -17% by 2050 — secular population decline; favor cash flow + early exit over multi-decade hold.
- At projected returns (-3.0% appreciation + 3.0% rent growth), your $45k cash investment doubles in ~10 years — after that, you're playing with house money.
- Climate carrying-cost: moderate wildfire risk; extreme-heat days projected 7→18/yr by 2055 (HVAC capex compounding) — expect insurance premiums to compound above CPI over the hold.
- Cap rate 9.6% vs local median 0.9% in Lake Lure — top-decile yield for the area; either an underpriced asset or a hidden risk that comps aren't pricing in. Stress-test before assuming the spread holds.
Questions for listing agent
- It's been on market 32 days. Have you received any prior offers? Is the seller open to a 3% concession, seller financing, or rate buy-down credit?
- Is there a deadline driving the sale (1031 exchange, divorce, estate, relocation)? That informs how much negotiation room exists.
- What's the average days-on-market for RENTAL listings here right now (not sales)? A rising rental-DOM trend means longer vacancies and softer asking-rent achievability than the comps imply.
- What's the recent tenant-quality profile in this submarket — average credit score on applications, eviction rate, late-payment / NSF rate, and stable-employment percentage? A property-management company in the area should have these aggregated.
- How much new for-sale + rental construction is in the pipeline within 1–3 miles? Heavy new supply typically softens prices + rents 12–24 months out; constrained supply supports both.
CashFlowRE · CFR-77YPWZEK6MSCC0
· Data 1 day ago
cashflowre.app · 2026-05-29