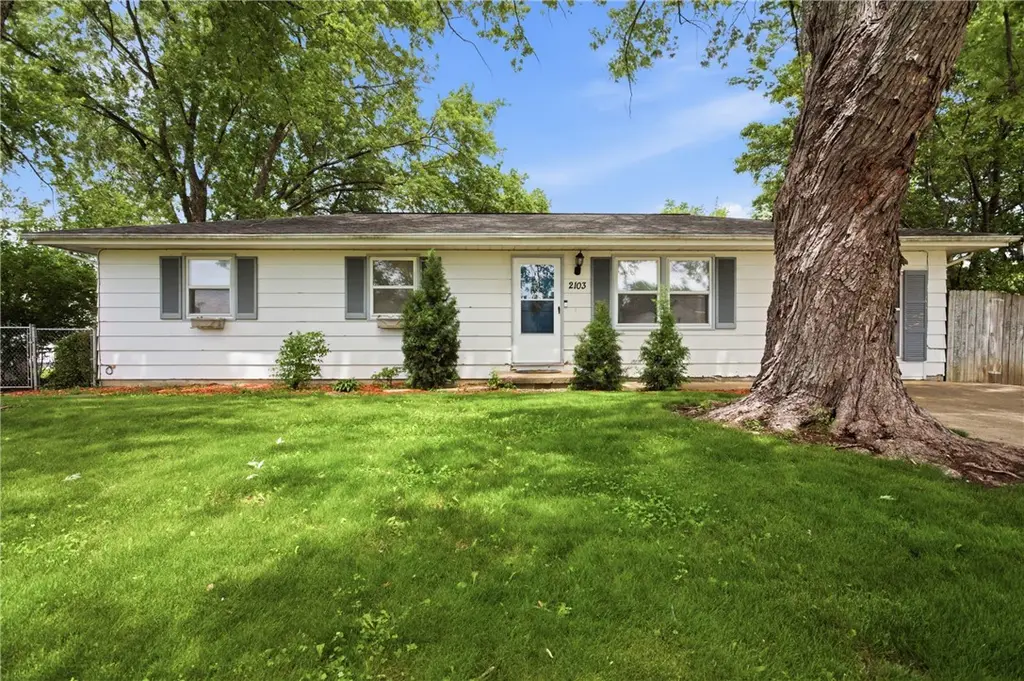
2103 Martin Ave
Charleston, IL 61920
$117,500D+
3 bd · 1.5 ba ·
1,296 sqft ·
Built 1979
· SingleFamily
· Pending
· 22 DOM
Cashflow @ list (25.0% down · 7.5%)
Estimated rent
$1,005/mo
Mortgage (P&I)
−$616
Tax + insurance
−$151
HOA
−$0
Vac / Maint / Mgmt
−$211
Net cashflow
$27/mo
Annual
$319/yr
Cap rate
6.56%
Cash-on-cash
0.97%
DSCR
1.04
1% rule
0.86%
Cash to close
$32,900
Investor read
- This is a 3-bed/1.5-bath single-family listed at $118k.
- At list price, monthly cash flow is $27 ($319/yr) — positive.
- The deal already cash-flows at list — no discount required.
- To meet the 1% rule (rent ≥ 1% of price), the offer needs to be $101k (14.5% below list).
- It's been on market 22 days — a 2% lower offer ($116k) is reasonable based on typical stale-listing flexibility.
- Recommended offer: $101k (14.5% below list) — sets the bar for 1% rule.
- Local home prices are declining (-3.0%/yr); year-one equity from $812 of loan paydown is wiped out by about $4k of value loss. Plan a longer hold.
- Location reads 73/100 on livability (#293 in IL) — a middle-class / working-renter tenant base. Strengths: cost of living A+, housing A+, health & safety A+; Watch: crime C-, amenities C-, commute F.
- Charleston CUSD 1 (town): math 14% / reading 21% proficiency, ranked #489 of 620 in IL (top 79%) — low school quality limits family demand, transient renter base, plan for 1-2y turnover.
- Zoned schools: Carl Sandburg Elem School (math 27% / reading 22%, grade F, #850 of 2,056 statewide, top 45%, 551 students, 0% FRL); Jefferson Elem School (math 10% / reading 23%, grade F, #482 of 665 statewide, top 73%, 635 students, 0% FRL); Charleston High School (math 20% / reading 24%, grade F, #319 of 693 statewide, top 50%, 766 students, 0% FRL) — zoned schools average 0% FRL vs 37% district-wide (37 pts lower); this property's tenant base skews higher-income than the district average.
- Market conditions: 125 active listings in the ZIP; 1 comparable units currently listed for rent nearby; 34 units permitted in Coles County in 2024 (30 in 5+ unit buildings).
- Coles County population projected to shrink 7% by 2050 — rents likely to lag national; underwrite the cash flow, not the appreciation.
- 5 sale attempts since 11y ago with the ask held roughly flat each time — persistent listings suggest the price (not the market) is what's stuck; bring a comps-based counter.
- Current owner paid $71k; list at $118k implies a 65% gain — meaningful room to come down on a strong offer.
- Cap rate 6.6% vs local median 4.0% in Charleston — top-decile yield for the area; either an underpriced asset or a hidden risk that comps aren't pricing in. Stress-test before assuming the spread holds.
Questions for listing agent
- Built in 1979 — when were the roof, HVAC, electrical panel, plumbing, and water heater last replaced?
- Is there a deadline driving the sale (1031 exchange, divorce, estate, relocation)? That informs how much negotiation room exists.
- Schools are F-rated, which usually means shorter tenancies and higher turnover. Who's the typical renter profile here, and what's been the actual vacancy rate?
- The area grade is low — what's the realistic commute time and amenity access for the typical tenant pool here? Any planned neighborhood developments (good or bad) we should know about?
- What's the average days-on-market for RENTAL listings here right now (not sales)? A rising rental-DOM trend means longer vacancies and softer asking-rent achievability than the comps imply.
- What's the recent tenant-quality profile in this submarket — average credit score on applications, eviction rate, late-payment / NSF rate, and stable-employment percentage? A property-management company in the area should have these aggregated.
- How much new for-sale + rental construction is in the pipeline within 1–3 miles? Heavy new supply typically softens prices + rents 12–24 months out; constrained supply supports both.
CashFlowRE · CFR-781MRV3H7GGXNF
· Data 1 week ago
cashflowre.app · 2026-05-29