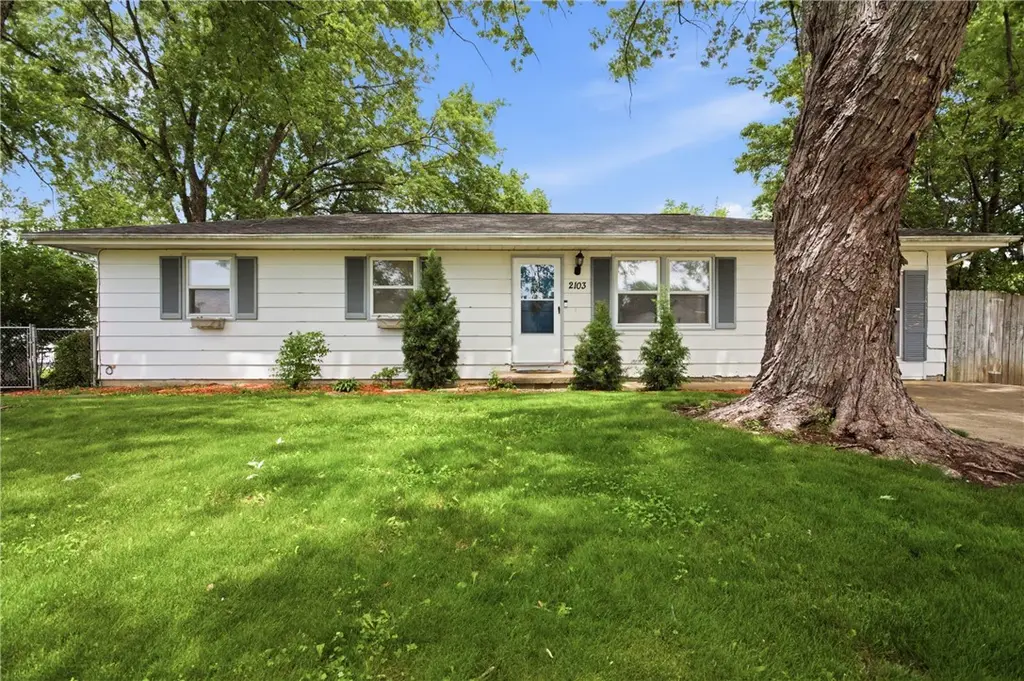
2103 Martin Ave · Charleston, IL
Flood risk 1/10 · Minimal
- FEMA flood zone
- X (unshaded)
- Chance of flooding over 30 yrs
- 0.0%
- Est. flood insurance / yr
- $507 – $1,088
Fire risk 1/10 · Minimal
- Est. fire insurance / yr
- $804 – $1,492
Heat risk 4/10 · Minor
- Hot days now (above 105°F)
- 7 days/yr
- Hot days in 30 yrs
- 19 days/yr
Wind risk 2/10 · Minimal
- Chance of severe wind over 30 yrs
- 2.0%
Air-quality risk 2/10 · Minimal
- Unhealthy air days now
- 1 days/yr
- Unhealthy air days in 30 yrs
- 1 days/yr
Risk factors via First Street. Map © Google.
Why this score? — see what drove the D+ grade
The composite is a weighted blend of 9 inputs, each scored 0–100. Each bar is that input's sub-score; the figure is the points it added to the 100-point composite (weight × sub-score).
- Cash flow +14.5/30.0
- ARV discount +12.5/15.0
- DSCR +4.4/10.0
- Livability +3.7/5.0
- 1% rule +3.6/10.0
- Rent growth +2.5/5.0
- Condition / age +2.5/5.0
- Schools +1.4/10.0
- Appreciation +0.0/10.0
$117,500
🖨 Deal sheet (PDF) 📄 Offer letter ✓ Due diligence
Listing remarks MLS
Look no further! This adorable 3 bedroom home at the end of a quiet street in Charleston is waitng for you. Newly installed laminate hardwood floors throughout the living room and bedrooms. The kitchen offers newer stainless steel appliances and custom metal ceiling. Enjoy the views of the fenced yard from the deck just off the kitchen. More updates include an encapsulated crawlspace, remodeled bathroom and custom shelving. Don't let this one get away, call today to schedule a private showing!
Key facts
- Large deck
- Built-in shelving
- Mature trees
Tags
Property features AI
Exterior
- Parking: Concrete road access
- Utilities: Public water; Public sewer
- Home design: Single family residence; One story
- Construction: Masonite exterior; Asphalt shingle roof
- Exterior features: Deck; Fenced yard; Shed(s)
Interior
- Kitchen: Microwave; Range; Range hood; Refrigerator
- Bedrooms: Total rooms: 7
- Bathrooms: 1 full bathroom
- Heating & cooling: Electric heating; Window air conditioning units
- Interior features: Kitchen island; Pantry; Walk-in closet(s); Crawl space basement
- Laundry & utility: Laundry on main level; Electric water heater
Neighborhood map
What this means for you Summary
Snapshot
- This is a 3-bed/1.5-bath single-family listed at $118k.
Deal economics
- At list price, monthly cash flow is $27 ($319/yr) — positive.
- The deal already cash-flows at list — no discount required.
- To meet the 1% rule (rent ≥ 1% of price), the offer needs to be $101k (14.5% below list).
- Recommended offer: $101k (14.5% below list) — sets the bar for 1% rule.
- Cap rate 6.6% vs local median 4.0% in Charleston — top-decile yield for the area; either an underpriced asset or a hidden risk that comps aren't pricing in. Stress-test before assuming the spread holds.
Location & tenants
- Location reads 73/100 on livability (#293 in IL) — a middle-class / working-renter tenant base. Strengths: cost of living A+, housing A+, health & safety A+; Watch: crime C-, amenities C-, commute F.
- Charleston CUSD 1 (town): math 14% / reading 21% proficiency, ranked #489 of 620 in IL (top 79%) — low school quality limits family demand, transient renter base, plan for 1-2y turnover.
- Zoned schools: Carl Sandburg Elem School (math 27% / reading 22%, grade F, #850 of 2,056 statewide, top 45%, 551 students, 0% FRL); Jefferson Elem School (math 10% / reading 23%, grade F, #482 of 665 statewide, top 73%, 635 students, 0% FRL); Charleston High School (math 20% / reading 24%, grade F, #319 of 693 statewide, top 50%, 766 students, 0% FRL) — zoned schools average 0% FRL vs 37% district-wide (37 pts lower); this property's tenant base skews higher-income than the district average.
- Market conditions: 125 active listings in the ZIP; 1 comparable units currently listed for rent nearby; 34 units permitted in Coles County in 2024 (30 in 5+ unit buildings).
Forward outlook
- Local home prices are declining (-3.0%/yr); year-one equity from $812 of loan paydown is wiped out by about $4k of value loss. Plan a longer hold.
- Coles County population projected to shrink 7% by 2050 — rents likely to lag national; underwrite the cash flow, not the appreciation.
Negotiation context
- It's been on market 22 days — a 2% lower offer ($116k) is reasonable based on typical stale-listing flexibility.
- 5 sale attempts since 11y ago with the ask held roughly flat each time — persistent listings suggest the price (not the market) is what's stuck; bring a comps-based counter.
- Current owner paid $71k; list at $118k implies a 65% gain — meaningful room to come down on a strong offer.
Questions for the listing agent
- Built in 1979 — when were the roof, HVAC, electrical panel, plumbing, and water heater last replaced?
- Is there a deadline driving the sale (1031 exchange, divorce, estate, relocation)? That informs how much negotiation room exists.
- Schools are F-rated, which usually means shorter tenancies and higher turnover. Who's the typical renter profile here, and what's been the actual vacancy rate?
- The area grade is low — what's the realistic commute time and amenity access for the typical tenant pool here? Any planned neighborhood developments (good or bad) we should know about?
- What's the average days-on-market for RENTAL listings here right now (not sales)? A rising rental-DOM trend means longer vacancies and softer asking-rent achievability than the comps imply.
- What's the recent tenant-quality profile in this submarket — average credit score on applications, eviction rate, late-payment / NSF rate, and stable-employment percentage? A property-management company in the area should have these aggregated.
- How much new for-sale + rental construction is in the pipeline within 1–3 miles? Heavy new supply typically softens prices + rents 12–24 months out; constrained supply supports both.
Investment metrics
- 1% rule
- 0.86% ✗
- Cap rate
- 6.56%
- Cash-on-cash
- 0.97%
- DSCR
- 1.04
- GRM
- 9.7
CMA / ARV
- ARV (on-the-fly)
- $132,192
- Comps found
- 12
Show comp detail 12 sales within ~0.75 mi
| Address | Dist | Beds/Ba | Sqft | Sold | Price | $/sf | Match |
|---|---|---|---|---|---|---|---|
| 29 Miller Ave | 0.23mi | 3/1.5 | 1,185 (-9%) | 3mo | $175,000 | $148 | 73 |
| 1310 Madison Ave | 0.53mi | 3/1.5 | 1,248 (-4%) | 0mo | $133,800 | $107 | 69 |
| 16 Miller Ave | 0.21mi | 3/1.0 | 1,150 (-11%) | 10mo | $161,250 | $140 | 61 |
| 823 19th St | 0.15mi | 2/1.0 (-1) | 1,170 (-10%) | 10mo | $60,000 | $51 | 61 |
| 1146 Buchanan Ave | 0.74mi | 3/1.0 | 1,326 (+2%) | 2mo | $134,900 | $102 | 58 |
| 1404 Madison Ave | 0.48mi | 3/1.0 | 1,449 (+12%) | 3mo | $20,000 | $14 | 54 |
| 1016 Hawthorne Dr | 0.39mi | 3/2.0 | 1,462 (+13%) | 8mo | $230,000 | $157 | 52 |
| 1524 Adams Ave | 0.47mi | 3/1.0 | 1,486 (+15%) | 5mo | $22,000 | $15 | 47 |
| 1203 Adams Ave | 0.66mi | 3/2.0 | 1,170 (-10%) | 10mo | $132,500 | $113 | 43 |
| 1402 14th St | 0.69mi | 4/2.0 (+1) | 1,430 (+10%) | 5mo | $78,000 | $55 | 40 |
| 9 Brosam Dr | 0.72mi | 3/2.0 | 1,452 (+12%) | 7mo | $135,000 | $93 | 38 |
| 1410 14th St | 0.72mi | 3/2.0 | 1,113 (-14%) | 10mo | $90,000 | $81 | 33 |
Match score weights: distance 35% · size 25% · config 20% · recency 20%. Top-matched comps best support the ARV.
Projected returns pro-forma
-3.0% appreciation · 3.0% rent growth · sell at horizon
- IRR
- -14.8%
- Equity multiple
- 0.47×
- Total profit
- $-17,358
- Equity at exit
- $17,520
- IRR
- -6.1%
- Equity multiple
- 0.61×
- Total profit
- $-12,982
- Equity at exit
- $10,159
Cash invested: $32,900 (down + closing). Projections, not guarantees.
Landlord ↔ Tenant lean methodology
- Overall (STATE)
- 43 Moderately Tenant-Leaning
- State Illinois
- 43 Moderately Tenant-Leaning · D+7
- County
- — inherits STATE
- City
- — inherits STATE
ZIP-level market 61920
- Home prices YoY
- -28.1%
- Active inventory
- 125
- Price-to-rent
- 9.7×
Monthly cashflow live
- Estimated rent
- $1,005 medium interval (Pro) →
- Mortgage (P&I)
- −$616
- Tax from tax record
- −$102 /mo · $1,228/yr
- Insurance
- −$49
- HOA
- −$0
- Vacancy / Maint / Mgmt
- −$211
- Net cashflow
- $27
Break-even live
Sensitivity live
| Price | -10% $93 | -5% $60 | +0% $27 | +5% $-7 | +10% $-40 |
|---|---|---|---|---|---|
| Rent | -10% $-53 | -5% $-13 | +0% $27 | +5% $66 | +10% $106 |
| Rate | -1.0pp $86 | -0.5pp $56 | base $27 | +0.5pp $-4 | +1.0pp $-35 |
UW: 25.0% down · 7.5% · 30yr · 1.5% tax · 5.0% vac · 8.0% maint · 8.0% mgmt
Financing live
Cash to close
- Down payment
- $29,375
- Closing costs
- $3,525
- Reserves months
- —
- Total cash needed
- —
Loan-product check · same deal, 3 products live
Conventional
25% down · 7.5% · 30yr
- Down + closing
- —
- Monthly P&I
- —
- Monthly cashflow
- —
- DSCR
- —
- Eligible?
- —
Personal DTI + credit; lowest rate.
DSCR
20% down · 8.5% · 30yr
- Down + closing
- —
- Monthly P&I
- —
- Monthly cashflow
- —
- DSCR
- —
- Eligible?
- —
No personal income docs; deal must DSCR.
Hard money
10% down · 12.0% · 12mo
- Down + closing
- —
- Monthly P&I
- —
- Monthly cashflow
- —
- DSCR
- —
- Eligible?
- —
Short-term bridge; refi at stabilization.
Rent comps 1 comps
| Address | Beds | Baths | Sqft | Rent | $/sqft | DOM | Units | Dist |
|---|---|---|---|---|---|---|---|---|
| 1408 6th St Charleston, IL | 2.0 | 1.0 | 1346 | $729 | $0.54 | 46d | 3 | 1.06mi |
Listing history 22 events
-
2026-06-12statusdays on market $117,500 Pending 22 DOM
-
2026-06-09days on market $117,500 Active Under Contract 20 DOM
-
2026-06-08days on market $117,500 Active Under Contract 19 DOM
-
2026-06-07days on market $117,500 Active Under Contract 18 DOM
-
2026-06-05days on market $117,500 Active Under Contract 15 DOM
-
2026-06-03days on market $117,500 Active Under Contract 14 DOM
-
2026-06-02days on market $117,500 Active Under Contract 13 DOM
-
2026-06-01days on market $117,500 Active Under Contract 12 DOM
-
2026-05-31days on market $117,500 Active Under Contract 11 DOM
-
2026-05-30days on market $117,500 Active Under Contract 10 DOM
-
2026-05-22historical Active Under Contract
-
2026-05-19$117,500 Active
-
2021-09-20soldstatus $71,000
-
2021-09-17soldstatus $71,000 499-char remark
Show marketing remark (501 chars)
Look no further! This adorable 3 bedroom home at the end of a quiet street in Charleston is waitng for you. Newly installed laminate hardwood floors throughout the living room and bedrooms. The kitchen offers newer stainless steel appliances and custom metal ceiling. Enjoy the views of the fenced yard from the deck just off the kitchen. More updates include an encapsulated crawlspace, remodeled bathroom and custom shelving. Don't let this one get away, call today to schedule a private showing!
-
2021-09-17soldstatus $71,000 501-char remark
Show marketing remark (501 chars)
Look no further! This adorable 3 bedroom home at the end of a quiet street in Charleston is waitng for you. Newly installed laminate hardwood floors throughout the living room and bedrooms. The kitchen offers newer stainless steel appliances and custom metal ceiling. Enjoy the views of the fenced yard from the deck just off the kitchen. More updates include an encapsulated crawlspace, remodeled bathroom and custom shelving. Don't let this one get away, call today to schedule a private showing!
-
2021-07-26$74,900 499-char remark
Show marketing remark (501 chars)
Look no further! This adorable 3 bedroom home at the end of a quiet street in Charleston is waitng for you. Newly installed laminate hardwood floors throughout the living room and bedrooms. The kitchen offers newer stainless steel appliances and custom metal ceiling. Enjoy the views of the fenced yard from the deck just off the kitchen. More updates include an encapsulated crawlspace, remodeled bathroom and custom shelving. Don't let this one get away, call today to schedule a private showing!
-
2021-07-26$74,900 501-char remark
Show marketing remark (501 chars)
Look no further! This adorable 3 bedroom home at the end of a quiet street in Charleston is waitng for you. Newly installed laminate hardwood floors throughout the living room and bedrooms. The kitchen offers newer stainless steel appliances and custom metal ceiling. Enjoy the views of the fenced yard from the deck just off the kitchen. More updates include an encapsulated crawlspace, remodeled bathroom and custom shelving. Don't let this one get away, call today to schedule a private showing!
-
2015-10-28soldstatus $69,000
-
2015-10-28soldstatus $69,000
-
2015-10-28soldstatus $69,000
-
2015-09-09$76,500
-
2015-09-09$76,500
ⓘ Source: listings_history table (triggers on properties + properties_extension) + one-shot
backfill from property_details.listing_events for pre-trigger history.
Tax reassessment forecast IL · Partial reset (capped growth)
- Current annual tax
- $1,228 · $102/mo
- Projected year-2 tax
- $1,948 · $162/mo
- Expected delta
- +$719/yr (+$60/mo · 58.6%)
ⓘ Screening estimate from a state-policy table — verify with the county assessor before closing.
Climate risk First Street
- Flood 1/10 Low FEMA zone X (unshaded) · 0% chance over 30 yrs
- Wildfire 1/10 Low
- Heat 4/10 Moderate 7 d/yr ≥105°F today · 19 d/yr by 30 yrs out
- Wind 2/10 Low 2% chance of damaging wind over 30 yrs
- Air quality 2/10 Low 1 unhealthy d/yr today · 1 by 30 yrs out
Nearby sold comps map
Loading sold comps map…
Walkable amenities ~0.75 mi
Loading nearby amenities…
Taxation est. · year 1
- Rental income
- $12,063
- − Mortgage interest
- −$6,582
- − Property taxes
- −$1,228
- − Insurance
- −$588
- − Repairs & maintenance
- −$965
- − Management
- −$965
- − Depreciation
- −$3,418
- Taxable loss
- −$1,683
- Est. tax savings @ 24.0%
- +$404
- After-tax cash flow
- $723/yr
For passive investors: Depreciation is non-cash, so a rental often shows a tax loss while cash-flowing — sheltering income. Rental losses are passive: they offset passive income freely, and up to $25,000/yr can offset ordinary (W-2) income if you actively participate and your MAGI is under $100k (phasing out to $0 by $150k); unused losses carry forward. On sale, claimed depreciation is recaptured at up to 25%, and gains may owe capital-gains tax (a 1031 exchange can defer both). Figures are a year-1 estimate at your 24.0% rate — not tax advice; consult a CPA.
Schools (NCES district)
- District
- Charleston CUSD 1
- NCES district ID
- 1709600
- Math proficiency
- 14% ▼ -6.00%
- Reading proficiency
- 21% ▼ -8.00%
- Median HH income
- $35,724
- Composite
- 14.45/100
- National rank
- #9429
- State rank
- #489 of 620 in IL
Livability — Charleston
- Score
- 73/100
- State rank
- #293
- US rank
- #5627
Category grades
Schools grade is shown separately in the Schools card above.
Census & demographics
- Census place
- Charleston, IL
- County
- Coles County · 41,301 people
- City population
- 20,951
- Metro
- Charleston-Mattoon, IL
- Population (ZIP)
- 20,951
- Household income
- $52,429
- Rent vs Own
- Severe rent burden
- 1209.0
Population outlook (Coles County) Hauer SSP2
- Today (2025)
- 53,967 people
- By 2030
- 53,829 · -0.3%
- By 2040
- 52,332 · -3.0%
- By 2050
- 49,989 · -7.4%
- By 2075
- 42,226 · -21.8%
- By 2100
- 34,675 · -35.7%
Race, ethnicity, and origin ACS 2023
- Neighborhood character
- Predominantly White (84%)
- Race & ethnicity
- White 84% Black 6% Hispanic / Latino 4% Two or more races 3% Asian 2%
- Common ancestry
- Italian 2% Romanian 2% Iranian 2%
- Foreign-born
- 4% · Canada, Jamaica
- Languages at home
- 95% English-only · Spanish 1% Other Indo-European 1%
Political lean MEDSL · Coles
- 2024 margin
- Strong R (+28.5) · D 34.9% · R 63.4% · Other 1.7%
- 2008→2024 swing
- -31.7pp toward R · 2008: 3.2pp · 2024: -28.5pp
- All cycles
- 2024: R+28.5 2020: R+26.4 2016: R+26.4 2012: R+11.1 2008: D+3.2
Not yet ingested
- Civics
- —
Market trends
- HPI YoY
- ▼ -59.97%
- Current HPI
- 153.8607
- Rent YoY
- —
- Metro
- Charleston-Mattoon, IL
- State GDP YoY
- ▲ 1.59%
- F500 in state
- 60
Industry mix (Fortune 500 HQ in IL)
| Industry | F500 HQs | Revenue |
|---|---|---|
| Insurance | 4 | $201B |
|
||
| Consumer Goods | 4 | $87B |
|
||
| Industrial Machinery | 3 | $64B |
|
||
| Healthcare | 2 | $55B |
|
||
| Retail / Pharmacy | 1 | $148B |
|
||
| Agriculture / Food | 1 | $86B |
|
||
Price history
+53.6% since first listed13 events — show timeline
- 2026-06-11 Pending — CIBR
- 2026-05-22 Contingent — CIBR
- 2026-05-19 Listed $117,500 CIBR
- 2021-09-20 Sold (Public Records) $71,000 Public Records
- 2021-09-17 Sold (MLS) $71,000 MRED as Distributed by MLS Grid
- 2021-09-17 Sold (MLS) $71,000 CIBR
- 2021-07-26 Listed $74,900 MRED as Distributed by MLS Grid
- 2021-07-26 Listed $74,900 CIBR
- 2015-10-28 Sold (Public Records) $69,000 Public Records
- 2015-10-28 Sold (MLS) $69,000 MRED as Distributed by MLS Grid
- 2015-10-28 Sold (MLS) $69,000 CIBR
- 2015-09-09 Listed $76,500 MRED as Distributed by MLS Grid
- 2015-09-09 Listed $76,500 CIBR
Property tax history
-3.3%/yrLatest (2025): $1,228 · +17.0% YoY. Source: county tax records.
Cash-flow waterfall
monthlySold comps — $/sqft
last 12 mo · ≤1 miLoading sold comps…