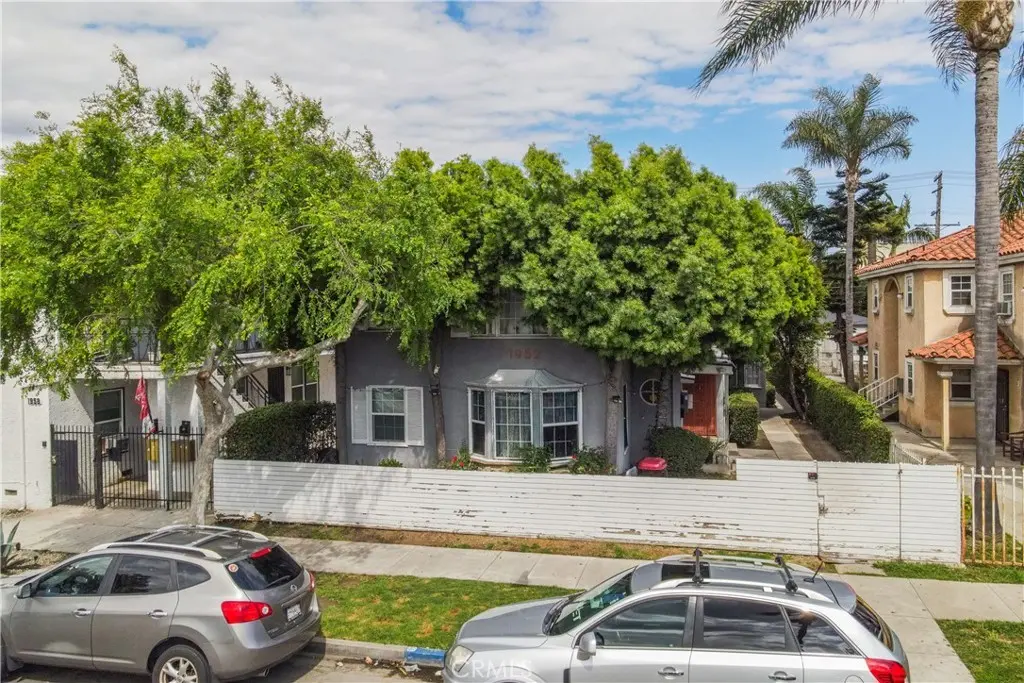
1952 Pine
Long Beach, CA 90806
$1,565,000D
6 bd · 6.0 ba ·
4,718 sqft ·
Built 1940
· MultiFamily
· Active
· 47 DOM
Cashflow @ list (25.0% down · 7.5%)
Estimated rent
$13,753/mo
Mortgage (P&I)
−$8,207
Tax + insurance
−$2,567
HOA
−$0
Vac / Maint / Mgmt
−$2,888
Net cashflow
$91/mo
Annual
$1,088/yr
Cap rate
6.36%
Cash-on-cash
0.25%
DSCR
1.01
1% rule
0.88%
Cash to close
$438,200
Investor read
- This is a 2×1bd/1ba + 6×2bd/1ba units multifamily listed at $1.56M.
- At list price, monthly cash flow is $91 ($1k/yr) — positive. Per door: $11/mo.
- The deal already cash-flows at list — no discount required.
- To meet the 1% rule (rent ≥ 1% of price), the offer needs to be $1.38M (12.1% below list).
- It's been on market 47 days — a 3% lower offer ($1.52M) is reasonable based on typical stale-listing flexibility.
- Recommended offer: $1.38M (12.1% below list) — sets the bar for 1% rule.
- Local home prices are declining (-3.0%/yr); year-one equity from $11k of loan paydown is wiped out by about $47k of value loss. Plan a longer hold.
- Location reads 67/100 on livability (#319 in CA) — a middle-class / working-renter tenant base. Strengths: amenities A+, commute A+, employment B+; Watch: health & safety C-, crime F, cost of living F.
- Long Beach Unified (urban): math 34% / reading 50% proficiency, ranked #216 of 517 in CA (top 42%) — families likely to look elsewhere, expect single-tenant / working-renter base with shorter leases.
- Zoned schools: Robinson Academy (math 21% / reading 33%, grade F, #917 of 1,571 statewide, top 60%, 729 students, 76% FRL); Helen Keller Middle (math 51% / reading 68%, grade B, #61 of 498 statewide, top 12%, 459 students, 31% FRL); Polytechnic High (math 54% / reading 72%, grade B-, #184 of 1,170 statewide, top 16%, 3,952 students, 54% FRL).
- Watch-outs: built in 1940 — expect roof / HVAC / electrical / plumbing capex.
- Market conditions: Rents flat; 47 active listings in the ZIP; solid renter incomes; 19,697 units permitted in Los Angeles County in 2024 (9,426 in 5+ unit buildings).
- Los Angeles County population projected at +9% by 2050 — modest demand growth; plan on rents tracking national, not racing it.
- 6 sale attempts since 23y ago with the ask held roughly flat each time — persistent listings suggest the price (not the market) is what's stuck; bring a comps-based counter.
- Cap rate 6.4% vs local median 1.9% in Long Beach — top-decile yield for the area; either an underpriced asset or a hidden risk that comps aren't pricing in. Stress-test before assuming the spread holds.
- At $13,753/mo this rent would consume 208% of the median local household income ($79k/yr) (locally 2135% of renters already pay >50% of income on rent) — very limited rent-growth headroom before tenants either downsize or default.
Questions for listing agent
- It's been on market 47 days. Have you received any prior offers? Is the seller open to a 12% concession, seller financing, or rate buy-down credit?
- Can we see the unit-by-unit rent roll, current vacancy, and any below-market leases? What's the average tenancy length?
- What capital expenditures (roof, boiler, parking lot, exteriors) have been made in the last 5 years, and what's planned in the next 2?
- Built in 1940 — when were the roof, HVAC, electrical panel, plumbing, and water heater last replaced?
- Is there a deadline driving the sale (1031 exchange, divorce, estate, relocation)? That informs how much negotiation room exists.
- Crime grade is F in this area — have there been break-ins, vandalism, or insurance claims at this property in the last 3 years? What carrier currently insures it and at what premium?
- The area grade is low — what's the realistic commute time and amenity access for the typical tenant pool here? Any planned neighborhood developments (good or bad) we should know about?
- What's the average days-on-market for RENTAL listings here right now (not sales)? A rising rental-DOM trend means longer vacancies and softer asking-rent achievability than the comps imply.
CashFlowRE · CFR-78QE7B0GTRKGD2
· Data 21 min ago
cashflowre.app · 2026-05-29