 8-Plex
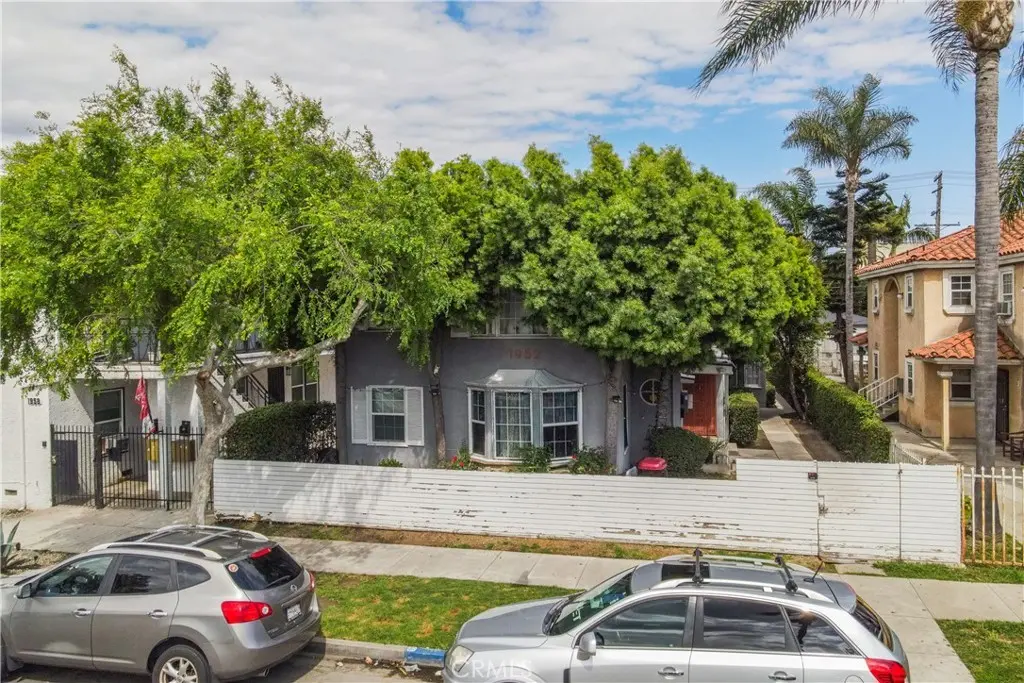
1952 Pine · Long Beach, CA
Flood risk 1/10 · Minimal
- FEMA flood zone
- X
- Chance of flooding over 30 yrs
- 0.0%
- Est. flood insurance / yr
- $507 – $1,088
Fire risk 1/10 · Minimal
- Est. fire insurance / yr
- $659 – $1,223
Heat risk 4/10 · Minor
- Hot days now (above 88°F)
- 7 days/yr
- Hot days in 30 yrs
- 24 days/yr
Wind risk 1/10 · Minimal
- Chance of severe wind over 30 yrs
- —
Air-quality risk 6/10 · Moderate
- Unhealthy air days now
- 9 days/yr
- Unhealthy air days in 30 yrs
- 10 days/yr
Risk factors via First Street. Map © Google.
Why this score? — see what drove the D grade
The composite is a weighted blend of 9 inputs, each scored 0–100. Each bar is that input's sub-score; the figure is the points it added to the 100-point composite (weight × sub-score).
- Cash flow +13.6/30.0
- ARV discount +11.0/15.0
- DSCR +4.1/10.0
- 1% rule +3.8/10.0
- Schools +3.7/10.0
- Livability +3.4/5.0
- Rent growth +2.7/5.0
- Condition / age +2.5/5.0
- Appreciation +0.0/10.0
$1,565,000
🖨 Deal sheet (PDF) 📄 Offer letter ✓ Due diligence
Multi-family units
County records classify this as Multi-Family (5+ Unit). Listing-text estimate: 8 units. confirmed
5+ unit building — per-unit beds/baths from public records are typically unavailable; the breakdown below (if shown) is an estimate from the listing text.
Listing remarks MLS
We are pleased to present the opportunity to purchase a rare, value-add offering that is cash flowing at a current 5.24% Cap Rate. The high cash flow provides a buyer the opportunity to purchase at a 60%+ LTV. Pine Ave consists of six units that have large floor plans situated on a 6,740 sq ft lot. Additionally, there is significant upside potential to add an additional two ADU units, and to utilize the two common courtyards for tenant amenities. 1952 Pine also benefits from four single car garages which are a commodity in Long Beach. Located near Downtown Long Beach, and proximate to the 710 & 405 Freeways, this is a strong rental location that will benefit a first time or seasoned investor. Note - the property consists of large 1bedroom units which operate as 2bedroom units.
Key facts
- Nearby metro line
- 8 unit building
- 2 brand new adus
Tags
Property features AI
Finance
- Other: Total of 8 residential units
- Financial info: Total building area reported as 5,490 (unit not reformatted); Gross scheduled income $175,620; Gross income $2,100; Net operating income $11,217; Gross multiplier 8.81; Operating expenses $56,768; Other income $2,100 (pet rent listed); Vacancy allowance rate 5%; Expense items include insurance, maintenance, gardener, pest control, utilities, taxes and licenses
- HOA & community: Rent control applies
Exterior
- Utilities: Public sewer; District/public water; One separate water meter; Eight separate gas meters; Eight separate electric meters
- Home design: Attached property; Two-story building; Property includes 2 accessory dwelling units (ADUs); Located in an urban community (Wrigley Area)
- Construction: Year built per assessor; Two buildings on the parcel
- Exterior features: No pool; Lot zoned approximately 6–10 units per acre
Interior
- Bedrooms: Eight 1-bedroom units (each unit listed as 1 bed)
- Interior features: Front entry; Entry on level 1
- Laundry & utility: No laundry on-site (none listed)
Neighborhood map
What this means for you Summary
Snapshot
- This is a 2×1bd/1ba + 6×2bd/1ba units multifamily listed at $1.56M.
Deal economics
- At list price, monthly cash flow is $91 ($1k/yr) — positive. Per door: $11/mo.
- The deal already cash-flows at list — no discount required.
- To meet the 1% rule (rent ≥ 1% of price), the offer needs to be $1.38M (12.1% below list).
- Recommended offer: $1.38M (12.1% below list) — sets the bar for 1% rule.
- Cap rate 6.4% vs local median 1.9% in Long Beach — top-decile yield for the area; either an underpriced asset or a hidden risk that comps aren't pricing in. Stress-test before assuming the spread holds.
Location & tenants
- Location reads 67/100 on livability (#319 in CA) — a middle-class / working-renter tenant base. Strengths: amenities A+, commute A+, employment B+; Watch: health & safety C-, crime F, cost of living F.
- Long Beach Unified (urban): math 34% / reading 50% proficiency, ranked #216 of 517 in CA (top 42%) — families likely to look elsewhere, expect single-tenant / working-renter base with shorter leases.
- Zoned schools: Robinson Academy (math 21% / reading 33%, grade F, #917 of 1,571 statewide, top 60%, 729 students, 76% FRL); Helen Keller Middle (math 51% / reading 68%, grade B, #61 of 498 statewide, top 12%, 459 students, 31% FRL); Polytechnic High (math 54% / reading 72%, grade B-, #184 of 1,170 statewide, top 16%, 3,952 students, 54% FRL).
- Market conditions: Rents flat; 48 active listings in the ZIP; solid renter incomes; 19,697 units permitted in Los Angeles County in 2024 (9,426 in 5+ unit buildings).
- At $13,753/mo this rent would consume 208% of the median local household income ($79k/yr) (locally 2135% of renters already pay >50% of income on rent) — very limited rent-growth headroom before tenants either downsize or default.
Forward outlook
- Local home prices are declining (-3.0%/yr); year-one equity from $11k of loan paydown is wiped out by about $47k of value loss. Plan a longer hold.
- Los Angeles County population projected at +9% by 2050 — modest demand growth; plan on rents tracking national, not racing it.
Negotiation context
- It's been on market 46 days — a 3% lower offer ($1.52M) is reasonable based on typical stale-listing flexibility.
- 6 sale attempts since 23y ago with the ask held roughly flat each time — persistent listings suggest the price (not the market) is what's stuck; bring a comps-based counter.
Risks & watch-outs
- Watch-outs: built in 1940 — expect roof / HVAC / electrical / plumbing capex.
Questions for the listing agent
- It's been on market 46 days. Have you received any prior offers? Is the seller open to a 12% concession, seller financing, or rate buy-down credit?
- Can we see the unit-by-unit rent roll, current vacancy, and any below-market leases? What's the average tenancy length?
- What capital expenditures (roof, boiler, parking lot, exteriors) have been made in the last 5 years, and what's planned in the next 2?
- Built in 1940 — when were the roof, HVAC, electrical panel, plumbing, and water heater last replaced?
- Is there a deadline driving the sale (1031 exchange, divorce, estate, relocation)? That informs how much negotiation room exists.
- Crime grade is F in this area — have there been break-ins, vandalism, or insurance claims at this property in the last 3 years? What carrier currently insures it and at what premium?
- The area grade is low — what's the realistic commute time and amenity access for the typical tenant pool here? Any planned neighborhood developments (good or bad) we should know about?
- What's the average days-on-market for RENTAL listings here right now (not sales)? A rising rental-DOM trend means longer vacancies and softer asking-rent achievability than the comps imply.
- What's the recent tenant-quality profile in this submarket — average credit score on applications, eviction rate, late-payment / NSF rate, and stable-employment percentage? A property-management company in the area should have these aggregated.
- How much new apartment / multifamily construction is in the pipeline within 1–3 miles? Heavy new supply (>2% of stock underway) typically softens rents 12–24 months out; light construction supports rent growth.
Investment metrics
- 1% rule
- 0.88% ✗
- Cap rate
- 6.36%
- Cash-on-cash
- 0.25%
- DSCR
- 1.01
- GRM
- 9.5
CMA / ARV
- ARV (median comp)
- $1,695,982
- List price
- $1,565,000
- Delta
- -7.72%
- Verdict
- FAIR
- Comps
- 20 within 1.0 mi
Show comp detail 2 sales within ~0.75 mi
| Address | Dist | Beds/Ba | Sqft | Sold | Price | $/sf | Match |
|---|---|---|---|---|---|---|---|
| 1526 Cedar Ave | 0.45mi | 7/6.0 (+1) | 4,464 (-5%) | 5mo | $1,105,000 | $248 | 61 |
| 1443 Linden Ave | 0.63mi | 7/8.0 (+1) | 4,348 (-8%) | 20mo | $900,000 | $207 | 28 |
Match score weights: distance 35% · size 25% · config 20% · recency 20%. Top-matched comps best support the ARV.
Projected returns pro-forma
-3.0% appreciation · 0.83% rent growth · sell at horizon
- IRR
- -18.4%
- Equity multiple
- 0.37×
- Total profit
- $-277,036
- Equity at exit
- $233,347
- IRR
- -15.6%
- Equity multiple
- 0.20×
- Total profit
- $-348,538
- Equity at exit
- $135,313
Cash invested: $438,200 (down + closing). Projections, not guarantees.
Landlord ↔ Tenant lean methodology
- Overall (STATE)
- 18 Strongly Tenant-Friendly
- State California
- 18 Strongly Tenant-Friendly · D+13
- County
- — inherits STATE
- City
- — inherits STATE
ZIP-level market 90806
- Rents YoY
- 0.8%
- Active inventory
- 48
- Price-to-rent
- 79.3×
Monthly cashflow live
- Estimated rent
- $13,753 high interval (Pro) →
- Mortgage (P&I)
- −$8,207
- Tax from tax record
- −$1,915 /mo · $22,982/yr
- Insurance
- −$652
- HOA
- −$0
- Vacancy / Maint / Mgmt
- −$2,888
- Net cashflow
- $91
Break-even live
Sensitivity live
| Price | -10% $977 | -5% $534 | +0% $91 | +5% $-352 | +10% $-795 |
|---|---|---|---|---|---|
| Rent | -10% $-996 | -5% $-453 | +0% $91 | +5% $634 | +10% $1,177 |
| Rate | -1.0pp $879 | -0.5pp $489 | base $91 | +0.5pp $-315 | +1.0pp $-727 |
8-unit breakdown (identical units grouped — click to expand)
| Units | Beds | Baths | Est. rent |
|---|---|---|---|
| 2× units | 1 | 1 | $3,288 |
| #1 | 1 | 1 | $1,644 |
| #2 | 1 | 1 | $1,644 |
| 6× units | 2 | 1 | $10,464 |
| #3 | 2 | 1 | $1,744 |
| #4 | 2 | 1 | $1,744 |
| #5 | 2 | 1 | $1,744 |
| #6 | 2 | 1 | $1,744 |
| #7 | 2 | 1 | $1,744 |
| #8 | 2 | 1 | $1,744 |
| Total (8 units) | $13,753 | ||
UW: 25.0% down · 7.5% · 30yr · 1.5% tax · 5.0% vac · 8.0% maint · 8.0% mgmt
Financing live
Cash to close
- Down payment
- $391,250
- Closing costs
- $46,950
- Reserves months
- —
- Total cash needed
- —
Loan-product check · same deal, 3 products live
Conventional
25% down · 7.5% · 30yr
- Down + closing
- —
- Monthly P&I
- —
- Monthly cashflow
- —
- DSCR
- —
- Eligible?
- —
Personal DTI + credit; lowest rate.
DSCR
20% down · 8.5% · 30yr
- Down + closing
- —
- Monthly P&I
- —
- Monthly cashflow
- —
- DSCR
- —
- Eligible?
- —
No personal income docs; deal must DSCR.
Hard money
10% down · 12.0% · 12mo
- Down + closing
- —
- Monthly P&I
- —
- Monthly cashflow
- —
- DSCR
- —
- Eligible?
- —
Short-term bridge; refi at stabilization.
Listing history 32 events
-
2026-06-21days on market $1,565,000 Active 46 DOM
-
2026-06-18days on market $1,565,000 Active 43 DOM
-
2026-06-17days on market $1,565,000 Active 42 DOM
-
2026-06-16days on market $1,565,000 Active 41 DOM
-
2026-06-15days on market $1,565,000 Active 40 DOM
-
2026-06-13days on market $1,565,000 Active 38 DOM
-
2026-06-13days on market $1,565,000 Active 37 DOM
-
2026-06-09days on market $1,565,000 Active 34 DOM
-
2026-06-08days on market $1,565,000 Active 33 DOM
-
2026-06-07days on market $1,565,000 Active 32 DOM
-
2026-06-04days on market $1,565,000 Active 29 DOM
-
2026-06-03days on market $1,565,000 Active 28 DOM
-
2026-06-02days on market $1,565,000 Active 27 DOM
-
2026-06-01days on market $1,565,000 Active 26 DOM
-
2026-05-31days on market $1,565,000 Active 25 DOM
-
2026-05-06$1,565,000 Active 809-char remark
-
2023-06-20soldstatus $1,620,000 Closed Sale 833-char remark
Show marketing remark (833 chars)
We are pleased to present the opportunity to purchase a rare, value-add offering that is cash flowing at a current 5.24% Cap Rate. The high cash flow provides a buyer the opportunity to purchase at a 60%+ LTV. Pine Ave consists of six units that have large floor plans situated on a 6,740 sq ft lot. Additionally, there is significant upside potential to add an additional two ADU units, and to utilize the two common courtyards for tenant amenities. 1952 Pine also benefits from four single car garages which are a commodity in Long Beach. Located near Downtown Long Beach, and proximate to the 710 & 405 Freeways, this is a strong rental location that will benefit a first time or seasoned investor. Note - the property consists of large 1bedroom units which operate as 2bedroom units.
-
2023-06-16soldstatus $1,620,000
-
2023-04-24status Pending Sale 833-char remark
Show marketing remark (833 chars)
We are pleased to present the opportunity to purchase a rare, value-add offering that is cash flowing at a current 5.24% Cap Rate. The high cash flow provides a buyer the opportunity to purchase at a 60%+ LTV. Pine Ave consists of six units that have large floor plans situated on a 6,740 sq ft lot. Additionally, there is significant upside potential to add an additional two ADU units, and to utilize the two common courtyards for tenant amenities. 1952 Pine also benefits from four single car garages which are a commodity in Long Beach. Located near Downtown Long Beach, and proximate to the 710 & 405 Freeways, this is a strong rental location that will benefit a first time or seasoned investor. Note - the property consists of large 1bedroom units which operate as 2bedroom units.
-
2023-02-21$1,699,000 Active 833-char remark
Show marketing remark (833 chars)
We are pleased to present the opportunity to purchase a rare, value-add offering that is cash flowing at a current 5.24% Cap Rate. The high cash flow provides a buyer the opportunity to purchase at a 60%+ LTV. Pine Ave consists of six units that have large floor plans situated on a 6,740 sq ft lot. Additionally, there is significant upside potential to add an additional two ADU units, and to utilize the two common courtyards for tenant amenities. 1952 Pine also benefits from four single car garages which are a commodity in Long Beach. Located near Downtown Long Beach, and proximate to the 710 & 405 Freeways, this is a strong rental location that will benefit a first time or seasoned investor. Note - the property consists of large 1bedroom units which operate as 2bedroom units.
-
2018-04-06soldstatus $1,075,000 Closed Sale
Show marketing remark (615 chars)
Located at 1952 Pine Avenue, this low rise multifamily asset was built in 1940 of wood frame construction on a concrete foundation. Assets of this age are highly desired by investors and tenants seeking newer construction. There are 6 total units, each with 1 bedroom, 1 bathroom and large dens with an average of 750 sq. ft. of living space. There are (4) 1 car garages. 3 of the units have been renovated kitchens which include copper plumbing. The remaining units are in excellent vintage condition. New water heater (master) was installed recently. Four new garage doors also recently installed in 2003.
-
2018-04-06soldstatus $1,075,000
Show marketing remark (615 chars)
Located at 1952 Pine Avenue, this low rise multifamily asset was built in 1940 of wood frame construction on a concrete foundation. Assets of this age are highly desired by investors and tenants seeking newer construction. There are 6 total units, each with 1 bedroom, 1 bathroom and large dens with an average of 750 sq. ft. of living space. There are (4) 1 car garages. 3 of the units have been renovated kitchens which include copper plumbing. The remaining units are in excellent vintage condition. New water heater (master) was installed recently. Four new garage doors also recently installed in 2003.
-
2018-03-04status Pending Sale
Show marketing remark (615 chars)
Located at 1952 Pine Avenue, this low rise multifamily asset was built in 1940 of wood frame construction on a concrete foundation. Assets of this age are highly desired by investors and tenants seeking newer construction. There are 6 total units, each with 1 bedroom, 1 bathroom and large dens with an average of 750 sq. ft. of living space. There are (4) 1 car garages. 3 of the units have been renovated kitchens which include copper plumbing. The remaining units are in excellent vintage condition. New water heater (master) was installed recently. Four new garage doors also recently installed in 2003.
-
2018-02-15$1,099,000 Active
Show marketing remark (615 chars)
Located at 1952 Pine Avenue, this low rise multifamily asset was built in 1940 of wood frame construction on a concrete foundation. Assets of this age are highly desired by investors and tenants seeking newer construction. There are 6 total units, each with 1 bedroom, 1 bathroom and large dens with an average of 750 sq. ft. of living space. There are (4) 1 car garages. 3 of the units have been renovated kitchens which include copper plumbing. The remaining units are in excellent vintage condition. New water heater (master) was installed recently. Four new garage doors also recently installed in 2003.
-
2018-02-15$1,099,000
Show marketing remark (615 chars)
Located at 1952 Pine Avenue, this low rise multifamily asset was built in 1940 of wood frame construction on a concrete foundation. Assets of this age are highly desired by investors and tenants seeking newer construction. There are 6 total units, each with 1 bedroom, 1 bathroom and large dens with an average of 750 sq. ft. of living space. There are (4) 1 car garages. 3 of the units have been renovated kitchens which include copper plumbing. The remaining units are in excellent vintage condition. New water heater (master) was installed recently. Four new garage doors also recently installed in 2003.
-
2006-08-01historical
-
2006-01-26$799,000
-
2003-11-18soldstatus $487,000
-
2003-11-14soldstatus $487,000
-
2003-09-09$479,000
-
2002-10-30soldstatus $290,000
ⓘ Source: listings_history table (triggers on properties + properties_extension) + one-shot
backfill from property_details.listing_events for pre-trigger history.
Tax reassessment forecast CA · Resets to sale price
- Current annual tax
- $22,982 · $1,915/mo
- Projected year-2 tax
- $22,982 · $1,915/mo
- Expected delta
- $0/yr ($0/mo · 0.0%)
ⓘ Screening estimate from a state-policy table — verify with the county assessor before closing.
Climate risk First Street
- Flood 1/10 Low FEMA zone X · 0% chance over 30 yrs
- Wildfire 1/10 Low
- Heat 4/10 Moderate 7 d/yr ≥88°F today · 24 d/yr by 30 yrs out
- Wind 1/10 Low
- Air quality 6/10 Major 9 unhealthy d/yr today · 10 by 30 yrs out
Nearby sold comps map
Loading sold comps map…
Walkable amenities ~0.75 mi
Loading nearby amenities…
Taxation est. · year 1
- Rental income
- $165,036
- − Mortgage interest
- −$87,664
- − Property taxes
- −$22,982
- − Insurance
- −$7,825
- − Repairs & maintenance
- −$13,203
- − Management
- −$13,203
- − Depreciation
- −$45,527
- Taxable loss
- −$25,368
- Est. tax savings @ 24.0%
- +$6,088
- After-tax cash flow
- $7,176/yr
For passive investors: Depreciation is non-cash, so a rental often shows a tax loss while cash-flowing — sheltering income. Rental losses are passive: they offset passive income freely, and up to $25,000/yr can offset ordinary (W-2) income if you actively participate and your MAGI is under $100k (phasing out to $0 by $150k); unused losses carry forward. On sale, claimed depreciation is recaptured at up to 25%, and gains may owe capital-gains tax (a 1031 exchange can defer both). Figures are a year-1 estimate at your 24.0% rate — not tax advice; consult a CPA.
Schools (NCES district)
- District
- Long Beach Unified
- NCES district ID
- 0622500
- Math proficiency
- 34% ▼ -11.00%
- Reading proficiency
- 50% ▼ -4.00%
- Median HH income
- $56,092
- Composite
- 36.67/100
- National rank
- #4607
- State rank
- #216 of 517 in CA
Livability — Long Beach
- Score
- 67/100
- State rank
- #319
- US rank
- #10758
Category grades
Schools grade is shown separately in the Schools card above.
Census & demographics
- Census place
- Long Beach, CA
- County
- Los Angeles County · 9,444,647 people
- City population
- 466,088
- Metro
- Los Angeles-Long Beach-Anaheim, CA
- Population (ZIP)
- 41,664
- Household income
- $79,208
- Rent vs Own
- Severe rent burden
- 2135.0
Population outlook (Los Angeles County) Hauer SSP2
- Today (2025)
- 10,940,515 people
- By 2030
- 11,256,481 · +2.9%
- By 2040
- 11,729,929 · +7.2%
- By 2050
- 11,948,407 · +9.2%
- By 2075
- 11,818,114 · +8.0%
- By 2100
- 10,842,928 · -0.9%
Race, ethnicity, and origin ACS 2023
- Neighborhood character
- Diverse neighborhood (Simpson 0.66)
- Race & ethnicity
- Hispanic / Latino 53% Asian 18% Two or more races 16% Black 14% White 11% Native American 1%
- Hispanic origin (detail)
- Mexican 43%
- Common ancestry
- Italian 1%
- Foreign-born
- 30% · Canada, Vietnam, China
- Languages at home
- 42% English-only · Spanish 43% Other Asian/Pacific 7% Tagalog/Filipino 5%
Political lean MEDSL · Los Angeles
- 2024 margin
- Solid D (+32.9) · D 64.8% · R 31.9% · Other 3.3%
- 2008→2024 swing
- -7.4pp toward R · 2008: 40.4pp · 2024: 32.9pp
- All cycles
- 2024: D+32.9 2020: D+44.2 2016: D+48.0 2012: D+40.0 2008: D+40.4
Not yet ingested
- Civics
- —
Market trends
- HPI YoY
- ▼ -687.38%
- Current HPI
- 457.1568
- Rent YoY
- ▲ 0.83%
- Metro
- Los Angeles-Long Beach-Anaheim, CA
- State GDP YoY
- ▲ 3.21%
- F500 in state
- 116
Industry mix (Fortune 500 HQ in CA)
| Industry | F500 HQs | Revenue |
|---|---|---|
| Technology | 27 | $1,492B |
|
||
| Financial Services | 3 | $174B |
|
||
| Retail | 3 | $44B |
|
||
| Insurance | 3 | $26B |
|
||
| Media / Entertainment | 2 | $115B |
|
||
| Pharmaceuticals / Biotech | 2 | $62B |
|
||
Price history
+439.7% since first listed17 events — show timeline
- 2026-05-06 Listed $1,565,000 CRMLS
- 2023-06-20 Sold (MLS) $1,620,000 CRMLS
- 2023-06-16 Sold (Public Records) $1,620,000 Public Records
- 2023-04-24 Pending — CRMLS
- 2023-02-21 Listed $1,699,000 CRMLS
- 2018-04-06 Sold (Public Records) $1,075,000 Public Records
- 2018-04-06 Sold (MLS) $1,075,000 SDMLS
- 2018-04-06 Sold (MLS) $1,075,000 CRMLS
- 2018-03-04 Pending — CRMLS
- 2018-02-15 Listed $1,099,000 SDMLS
- 2018-02-15 Listed $1,099,000 CRMLS
- 2006-08-01 Listing Removed — CRMLS
- 2006-01-26 Listed $799,000 CRMLS
- 2003-11-18 Sold (MLS) $487,000 CRMLS
- 2003-11-14 Sold (Public Records) $487,000 Public Records
- 2003-09-09 Listed $479,000 CRMLS
- 2002-10-30 Sold (Public Records) $290,000 Public Records
Property tax history
+7.9%/yrLatest (2025): $22,982 · +4.5% YoY. Source: county tax records.
Cash-flow waterfall
monthlySold comps — $/sqft
last 12 mo · ≤1 miLoading sold comps…