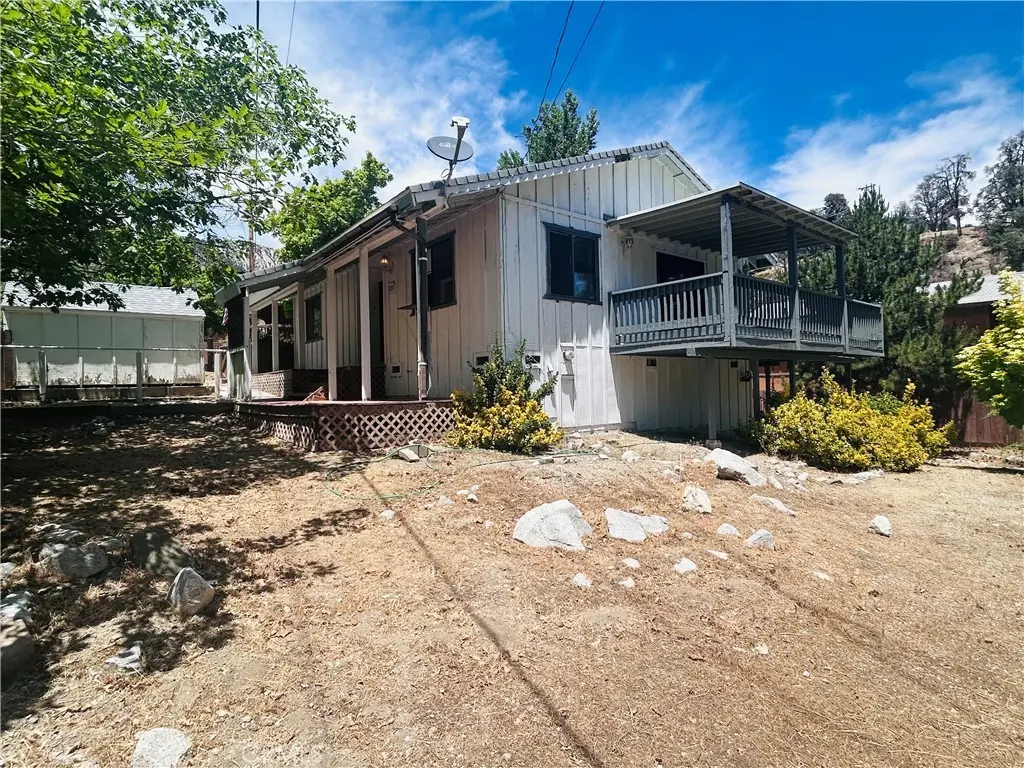
832 Elm
Frazier Park, CA 93225
$270,000D-
2 bd · 1.0 ba ·
1,316 sqft ·
Built 1984
· SingleFamily
· Active
· 16 DOM
Cashflow @ list (25.0% down · 7.5%)
Estimated rent
$2,247/mo
Mortgage (P&I)
−$1,416
Tax + insurance
−$290
HOA
−$0
Vac / Maint / Mgmt
−$472
Net cashflow
$69/mo
Annual
$828/yr
Cap rate
6.60%
Cash-on-cash
1.10%
DSCR
1.05
1% rule
0.83%
Cash to close
$75,600
Investor read
- This is a 2-bed/1.0-bath single-family listed at $270k.
- At list price, monthly cash flow is $69 ($828/yr) — positive.
- The deal already cash-flows at list — no discount required.
- To meet the 1% rule (rent ≥ 1% of price), the offer needs to be $225k (16.8% below list).
- It's been on market 16 days — a 2% lower offer ($266k) is reasonable based on typical stale-listing flexibility.
- Recommended offer: $225k (16.8% below list) — sets the bar for 1% rule.
- Local home prices are declining (-3.0%/yr); year-one equity from $2k of loan paydown is wiped out by about $8k of value loss. Plan a longer hold.
- Location reads 51/100 on livability (#1,064 in CA) — a working-class tenant base; expect higher turnover. Strengths: housing A; Watch: schools D+, amenities F, commute F.
- El Tejon Unified (rural): math 13% / reading 45% proficiency, ranked #361 of 517 in CA (top 70%) — low school quality limits family demand, transient renter base, plan for 1-2y turnover.
- Market conditions: 122 active listings in the ZIP; 6 comparable units currently listed for rent nearby; rentals leasing fast (median 3d on market — plan ~1-2 weeks tenant-placement turnaround); 3,244 units permitted in Kern County in 2024 (73 in 5+ unit buildings).
- Kern County population projected at +17% by 2050 — long-run rental-demand tailwind backs the buy-and-hold thesis.
- 7 sale attempts since 17y ago with the ask held roughly flat each time — persistent listings suggest the price (not the market) is what's stuck; bring a comps-based counter.
- Current owner paid $82k; list at $270k implies a 229% gain — meaningful room to come down on a strong offer.
- Climate carrying-cost: severe wildfire risk — expect insurance premiums to compound above CPI over the hold.
- Cap rate 6.6% vs local median 4.6% in Frazier Park — top-decile yield for the area; either an underpriced asset or a hidden risk that comps aren't pricing in. Stress-test before assuming the spread holds.
Questions for listing agent
- Is there a deadline driving the sale (1031 exchange, divorce, estate, relocation)? That informs how much negotiation room exists.
- Schools are D-rated, which usually means shorter tenancies and higher turnover. Who's the typical renter profile here, and what's been the actual vacancy rate?
- The area grade is low — what's the realistic commute time and amenity access for the typical tenant pool here? Any planned neighborhood developments (good or bad) we should know about?
- What's the average days-on-market for RENTAL listings here right now (not sales)? A rising rental-DOM trend means longer vacancies and softer asking-rent achievability than the comps imply.
- What's the recent tenant-quality profile in this submarket — average credit score on applications, eviction rate, late-payment / NSF rate, and stable-employment percentage? A property-management company in the area should have these aggregated.
- How much new for-sale + rental construction is in the pipeline within 1–3 miles? Heavy new supply typically softens prices + rents 12–24 months out; constrained supply supports both.
CashFlowRE · CFR-791FS9520TP9EP
· Data 2 days ago
cashflowre.app · 2026-05-29