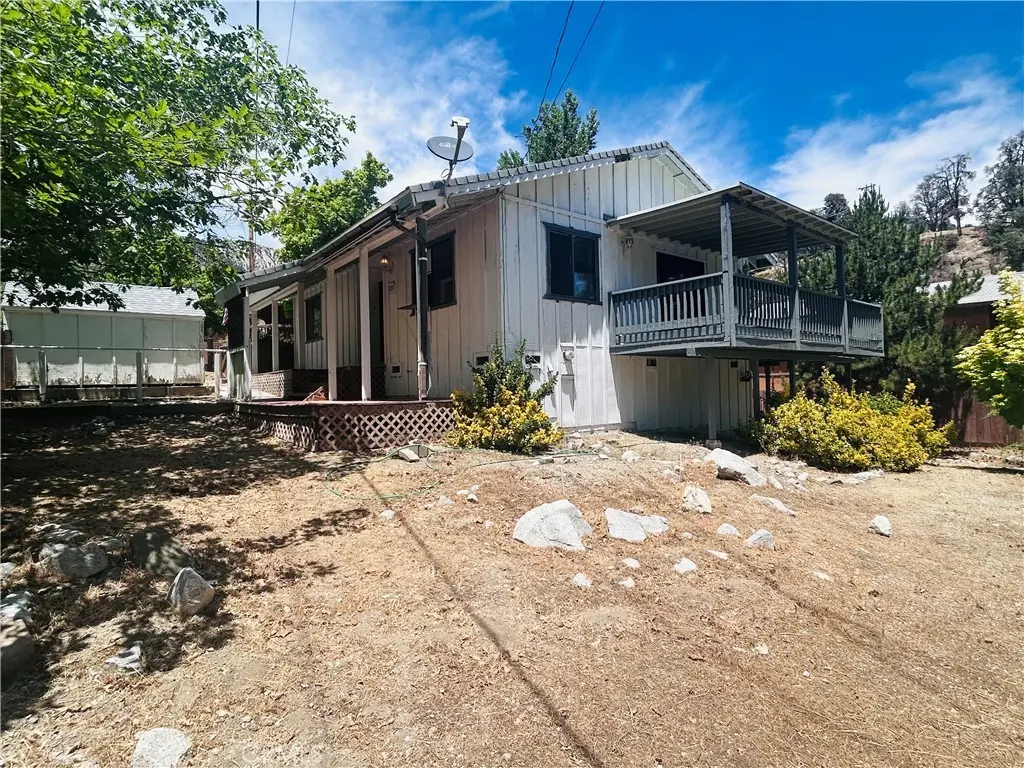
832 Elm · Frazier Park, CA
Flood risk 1/10 · Minimal
- FEMA flood zone
- X (unshaded)
- Chance of flooding over 30 yrs
- 0.0%
- Est. flood insurance / yr
- $507 – $1,088
Fire risk 9/10 · Severe
- Est. fire insurance / yr
- $659 – $1,223
Heat risk 3/10 · Minor
- Hot days now (above 88°F)
- 11 days/yr
- Hot days in 30 yrs
- 28 days/yr
Wind risk 1/10 · Minimal
- Chance of severe wind over 30 yrs
- —
Air-quality risk 7/10 · Major
- Unhealthy air days now
- 14 days/yr
- Unhealthy air days in 30 yrs
- 18 days/yr
Risk factors via First Street. Map © Google.
Why this score? — see what drove the D- grade
The composite is a weighted blend of 9 inputs, each scored 0–100. Each bar is that input's sub-score; the figure is the points it added to the 100-point composite (weight × sub-score).
- Cash flow +14.7/30.0
- ARV discount +6.3/15.0
- DSCR +4.5/10.0
- 1% rule +3.3/10.0
- Livability +2.6/5.0
- Rent growth +2.5/5.0
- Schools +2.5/10.0
- Condition / age +2.5/5.0
- Appreciation +0.0/10.0
$270,000
🖨 Deal sheet 📄 Offer letter ✓ Due diligence
Listing remarks MLS
2 bed/2 bath home with exterior deck and nice mountain views. . new interior paint, carpet, vinyl and appliances are among the numerous repairs carried out on this property.
Key facts
- Fenced yard
- Two inviting decks
- Peaceful views
Tags
Property features AI
Finance
- HOA & community: Mountainous community
Exterior
- Utilities: Public/District water; Septic tank sewer
- Home design: House; Single-story; No accessory dwelling unit
- Construction: Year built per public records
- Exterior features: Front yard; No pool
Interior
- Kitchen: Kitchen
- Bedrooms: 2 bedrooms on the main level
- Bathrooms: 1 full bathroom; 1 three-quarter bathroom
- Interior features: One-level home; Main level entry; Mountain view
- Laundry & utility: Laundry inside the home
Neighborhood map
What this means for you Summary
Snapshot
- This is a 2-bed/1.0-bath single-family listed at $270k.
Deal economics
- At list price, monthly cash flow is $69 ($828/yr) — positive.
- The deal already cash-flows at list — no discount required.
- To meet the 1% rule (rent ≥ 1% of price), the offer needs to be $225k (16.8% below list).
- Recommended offer: $225k (16.8% below list) — sets the bar for 1% rule.
- Cap rate 6.6% vs local median 4.6% in Frazier Park — top-decile yield for the area; either an underpriced asset or a hidden risk that comps aren't pricing in. Stress-test before assuming the spread holds.
Location & tenants
- Location reads 51/100 on livability (#1,064 in CA) — a working-class tenant base; expect higher turnover. Strengths: housing A; Watch: schools D+, amenities F, commute F.
- El Tejon Unified (rural): math 13% / reading 45% proficiency, ranked #361 of 517 in CA (top 70%) — low school quality limits family demand, transient renter base, plan for 1-2y turnover.
- Market conditions: 122 active listings in the ZIP; 6 comparable units currently listed for rent nearby; rentals leasing fast (median 3d on market — plan ~1-2 weeks tenant-placement turnaround); 3,244 units permitted in Kern County in 2024 (73 in 5+ unit buildings).
Forward outlook
- Local home prices are declining (-3.0%/yr); year-one equity from $2k of loan paydown is wiped out by about $8k of value loss. Plan a longer hold.
- Kern County population projected at +17% by 2050 — long-run rental-demand tailwind backs the buy-and-hold thesis.
Negotiation context
- It's been on market 16 days — a 2% lower offer ($266k) is reasonable based on typical stale-listing flexibility.
- 7 sale attempts since 17y ago with the ask held roughly flat each time — persistent listings suggest the price (not the market) is what's stuck; bring a comps-based counter.
- Current owner paid $82k; list at $270k implies a 229% gain — meaningful room to come down on a strong offer.
Risks & watch-outs
- Climate carrying-cost: severe wildfire risk — expect insurance premiums to compound above CPI over the hold.
Questions for the listing agent
- Is there a deadline driving the sale (1031 exchange, divorce, estate, relocation)? That informs how much negotiation room exists.
- Schools are D-rated, which usually means shorter tenancies and higher turnover. Who's the typical renter profile here, and what's been the actual vacancy rate?
- The area grade is low — what's the realistic commute time and amenity access for the typical tenant pool here? Any planned neighborhood developments (good or bad) we should know about?
- What's the average days-on-market for RENTAL listings here right now (not sales)? A rising rental-DOM trend means longer vacancies and softer asking-rent achievability than the comps imply.
- What's the recent tenant-quality profile in this submarket — average credit score on applications, eviction rate, late-payment / NSF rate, and stable-employment percentage? A property-management company in the area should have these aggregated.
- How much new for-sale + rental construction is in the pipeline within 1–3 miles? Heavy new supply typically softens prices + rents 12–24 months out; constrained supply supports both.
Investment metrics
- 1% rule
- 0.83% ✗
- Cap rate
- 6.60%
- Cash-on-cash
- 1.10%
- DSCR
- 1.05
- GRM
- 10.0
CMA / ARV
- ARV (on-the-fly)
- $263,200
- Comps found
- 12
Show comp detail 12 sales within ~0.75 mi
| Address | Dist | Beds/Ba | Sqft | Sold | Price | $/sf | Match |
|---|---|---|---|---|---|---|---|
| 3809 Arroyo Trl | 0.37mi | 2/1.0 | 1,260 (-4%) | 2mo | $250,000 | $198 | 74 |
| 4141 Willow Trl | 0.06mi | 3/2.0 (+1) | 1,187 (-10%) | 7mo | $326,600 | $275 | 66 |
| 3820 Rotary Trl | 0.56mi | 3/2.0 (+1) | 1,338 (+2%) | 1mo | $325,000 | $243 | 61 |
| 3801 Los Padres | 0.31mi | 3/2.0 (+1) | 1,192 (-9%) | 0mo | $238,000 | $200 | 60 |
| 4017 Los Padres Dr | 0.14mi | 2/1.5 | 1,190 (-10%) | 18mo | $310,000 | $261 | 60 |
| 724 Avalon | 0.22mi | 2/2.0 | 1,152 (-12%) | 6mo | $170,000 | $148 | 60 |
| 716 Avalon Trl | 0.23mi | 3/2.0 (+1) | 1,381 (+5%) | 15mo | $270,000 | $196 | 60 |
| 3724 Encino Trl | 0.55mi | 3/2.0 (+1) | 1,272 (-3%) | 10mo | $200,000 | $157 | 52 |
| 317 Pine Canyon Dr | 0.59mi | 2/1.5 | 1,232 (-6%) | 11mo | $285,000 | $231 | 51 |
| 3417 Los Padres | 0.72mi | 3/2.0 (+1) | 1,384 (+5%) | 10mo | $270,000 | $195 | 40 |
| 736 San Emidio | 0.71mi | 3/2.0 (+1) | 1,450 (+10%) | 3mo | $345,000 | $238 | 38 |
| 259 South End Dr | 0.70mi | 3/2.0 (+1) | 1,200 (-9%) | 19mo | $229,000 | $191 | 28 |
Match score weights: distance 35% · size 25% · config 20% · recency 20%. Top-matched comps best support the ARV.
Projected returns pro-forma
-3.0% appreciation · 3.0% rent growth · sell at horizon
- IRR
- -14.6%
- Equity multiple
- 0.48×
- Total profit
- $-39,421
- Equity at exit
- $40,258
- IRR
- -5.9%
- Equity multiple
- 0.62×
- Total profit
- $-28,928
- Equity at exit
- $23,345
Cash invested: $75,600 (down + closing). Projections, not guarantees.
Landlord ↔ Tenant lean methodology
- Overall (STATE)
- 18 Strongly Tenant-Friendly
- State California
- 18 Strongly Tenant-Friendly · D+13
- County
- — inherits STATE
- City
- — inherits STATE
ZIP-level market 93225
- Home prices YoY
- -5.5%
- Active inventory
- 122
- Price-to-rent
- 10.0×
Monthly cashflow live
- Estimated rent
- $2,247 high interval (Pro) →
- Mortgage (P&I)
- −$1,416
- Tax from tax record
- −$178 /mo · $2,135/yr
- Insurance
- −$112
- HOA
- −$0
- Vacancy / Maint / Mgmt
- −$472
- Net cashflow
- $69
Break-even live
UW: 25.0% down · 7.5% · 30yr · 1.5% tax · 5.0% vac · 8.0% maint · 8.0% mgmt
Financing live
Cash to close
- Down payment
- $67,500
- Closing costs
- $8,100
- Reserves months
- —
- Total cash needed
- —
Loan-product check · same deal, 3 products live
Conventional
25% down · 7.5% · 30yr
- Down + closing
- —
- Monthly P&I
- —
- Monthly cashflow
- —
- DSCR
- —
- Eligible?
- —
Personal DTI + credit; lowest rate.
DSCR
20% down · 8.5% · 30yr
- Down + closing
- —
- Monthly P&I
- —
- Monthly cashflow
- —
- DSCR
- —
- Eligible?
- —
No personal income docs; deal must DSCR.
Hard money
10% down · 12.0% · 12mo
- Down + closing
- —
- Monthly P&I
- —
- Monthly cashflow
- —
- DSCR
- —
- Eligible?
- —
Short-term bridge; refi at stabilization.
Rent comps 6 comps
| Address | Beds | Baths | Sqft | Rent | $/sqft | DOM | Units | Dist |
|---|---|---|---|---|---|---|---|---|
| 4136 Poplar Trl Frazier Park, CA | 3.0 | 1.0 | 968 | $2,500 | $2.58 | 1d | 1 | 0.11mi |
| 728 Catalina Trl Frazier Park, CA | 3.0 | 2.0 | 1354 | $1,750 | $1.29 | 17d | 1 | 0.37mi |
| 4108 Roosevelt Trl Frazier Park, CA | 3.0 | 3.0 | 1470 | $2,500 | $1.70 | 2d | 1 | 0.39mi |
| 4424 High Trl Frazier Park, CA | 2.0 | 1.0 | 936 | $1,950 | $2.08 | 1d | 1 | 0.46mi |
| 921 Center Way Frazier Park, CA | 2.0 | 1.0 | 1066 | $1,695 | $1.59 | 43d | 1 | 0.67mi |
| 221 E End Dr Frazier Park, CA | 3.0 | 1.0 | 911 | $2,450 | $2.69 | 1d | 1 | 0.81mi |
Listing history 13 events
-
2026-06-18days on market $270,000 Active 16 DOM
-
2026-06-17days on market $270,000 Active 15 DOM
-
2026-06-16days on market $270,000 Active 14 DOM
-
2026-06-15days on market $270,000 Active 13 DOM
-
2026-06-14statusdays on market $270,000 Active 11 DOM
-
2026-06-13statusdays on market $270,000 Active Under Contract 10 DOM
-
2026-06-10days on market $270,000 Active 8 DOM
-
2026-06-09days on market $270,000 Active 7 DOM
-
2026-06-08days on market $270,000 Active 6 DOM
-
2026-06-07days on market $270,000 Active 5 DOM
-
2026-06-05days on market $270,000 Active 2 DOM
-
2026-06-03remarks 565-char remark
-
2026-06-03$270,000 Active 1 DOM
ⓘ Source: listings_history table (triggers on properties + properties_extension) + one-shot
backfill from property_details.listing_events for pre-trigger history.
Tax reassessment forecast CA · Resets to sale price
- Current annual tax
- $2,135 · $178/mo
- Projected year-2 tax
- $2,135 · $178/mo
- Expected delta
- $0/yr ($0/mo · 0.0%)
ⓘ Screening estimate from a state-policy table — verify with the county assessor before closing.
Climate risk First Street
- Flood 1/10 Low FEMA zone X (unshaded) · 0% chance over 30 yrs
- Wildfire 9/10 Extreme
- Heat 3/10 Moderate 11 d/yr ≥88°F today · 28 d/yr by 30 yrs out
- Wind 1/10 Low
- Air quality 7/10 Severe 14 unhealthy d/yr today · 18 by 30 yrs out
Nearby sold comps map
Loading sold comps map…
Walkable amenities ~0.75 mi
Loading nearby amenities…
Taxation est. · year 1
- Rental income
- $26,967
- − Mortgage interest
- −$15,124
- − Property taxes
- −$2,135
- − Insurance
- −$1,350
- − Repairs & maintenance
- −$2,157
- − Management
- −$2,157
- − Depreciation
- −$7,855
- Taxable loss
- −$3,811
- Est. tax savings @ 24.0%
- +$915
- After-tax cash flow
- $1,743/yr
For passive investors: Depreciation is non-cash, so a rental often shows a tax loss while cash-flowing — sheltering income. Rental losses are passive: they offset passive income freely, and up to $25,000/yr can offset ordinary (W-2) income if you actively participate and your MAGI is under $100k (phasing out to $0 by $150k); unused losses carry forward. On sale, claimed depreciation is recaptured at up to 25%, and gains may owe capital-gains tax (a 1031 exchange can defer both). Figures are a year-1 estimate at your 24.0% rate — not tax advice; consult a CPA.
Schools (NCES district)
- District
- El Tejon Unified
- NCES district ID
- 0600026
- Math proficiency
- 13% ▼ -12.00%
- Reading proficiency
- 45% ▼ -2.00%
- Median HH income
- $49,019
- Composite
- 25.15/100
- National rank
- #7519
- State rank
- #361 of 517 in CA
Livability — Frazier Park
- Score
- 51/100
- State rank
- #1064
- US rank
- #25253
Category grades
Schools grade is shown separately in the Schools card above.
Census & demographics
- Census place
- Frazier Park, CA
- Population (ZIP)
- 4,532
Population outlook (Kern County) Hauer SSP2
- Today (2025)
- 947,286 people
- By 2030
- 978,984 · +3.3%
- By 2040
- 1,045,018 · +10.3%
- By 2050
- 1,105,232 · +16.7%
- By 2075
- 1,229,538 · +29.8%
- By 2100
- 1,238,059 · +30.7%
Race, ethnicity, and origin ACS 2023
- Neighborhood character
- Predominantly White (83%)
- Race & ethnicity
- White 83% Hispanic / Latino 14% Two or more races 8%
- Hispanic origin (detail)
- Mexican 8%
- Common ancestry
- Slovak 5% Serbian 3% Portuguese 3%
- Foreign-born
- 9% · Canada, South Korea
- Languages at home
- 90% English-only · Spanish 8% Arabic 1%
Political lean MEDSL · Kern
- 2024 margin
- Strong R (+21.1) · D 38.2% · R 59.3% · Other 2.5%
- 2008→2024 swing
- -3.3pp toward R · 2008: -17.8pp · 2024: -21.1pp
- All cycles
- 2024: R+21.1 2020: R+10.2 2016: R+15.0 2012: R+20.9 2008: R+17.8
Not yet ingested
- Civics
- —
Market trends
- HPI YoY
- ▼ -20.47%
- Current HPI
- 354.6398
- Rent YoY
- —
- Metro
- —
- State GDP YoY
- ▲ 3.21%
- F500 in state
- 116
Industry mix (Fortune 500 HQ in CA)
| Industry | F500 HQs | Revenue |
|---|---|---|
| Technology | 27 | $1,492B |
|
||
| Financial Services | 3 | $174B |
|
||
| Retail | 3 | $44B |
|
||
| Insurance | 3 | $26B |
|
||
| Media / Entertainment | 2 | $115B |
|
||
| Pharmaceuticals / Biotech | 2 | $62B |
|
||
Price history
+309.1% since first listed18 events — show timeline
- 2026-06-02 Listed $270,000 CRMLS
- 2011-06-02 Sold (Public Records) $82,000 Public Records
- 2011-06-02 Sold (MLS) $82,000 AVMLS
- 2011-06-02 Sold (MLS) $82,000 CRMLS
- 2011-05-26 Sold (MLS) $82,000 GEMLS
- 2011-05-24 Listing Removed — CRMLS
- 2011-05-20 Price Changed $89,900 GEMLS
- 2011-05-20 Delisted — GEMLS
- 2011-02-19 Listed $82,000 GEMLS
- 2011-02-19 Listed $89,900 AVMLS
- 2011-02-19 Listed $89,900 CRMLS
- 2011-01-15 Listing Removed — CRMLS
- 2010-06-16 Listing Removed — CRMLS
- 2010-06-15 Listed $89,900 CRMLS
- 2010-03-15 Listed $89,900 CRMLS
- 2010-02-15 Listing Removed — CRMLS
- 2009-11-20 Listed $99,900 CRMLS
- 1997-04-03 Sold (Public Records) $66,000 Public Records
Property tax history
+7.2%/yrLatest (2025): $2,135 · +18.1% YoY. Source: county tax records.
Cash-flow waterfall
monthlySold comps — $/sqft
last 12 mo · ≤1 miLoading sold comps…