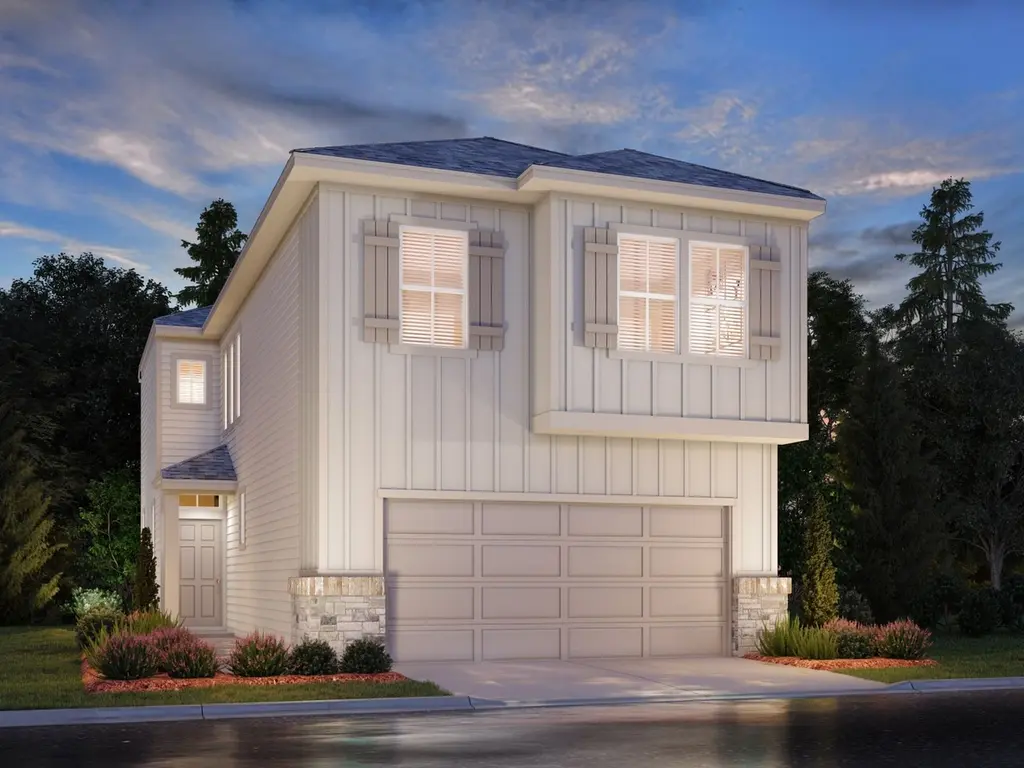
4215 Pine Springs Ct
Missouri City, TX 77459
$330,540D-
3 bd · 2.5 ba ·
1,852 sqft ·
Built 2026
· SingleFamily
· Active
· 16 DOM
Cashflow @ list (25.0% down · 7.5%)
Estimated rent
$2,515/mo
Mortgage (P&I)
−$1,733
Tax + insurance
−$551
HOA
−$0
Vac / Maint / Mgmt
−$528
Net cashflow
$-297/mo
Annual
$-3,568/yr
Cap rate
5.21%
Cash-on-cash
-3.86%
DSCR
0.83
1% rule
0.76%
Cash to close
$92,551
Investor read
- This is a 3-bed/2.5-bath single-family listed at $331k.
- At list price, monthly cash flow is $-297 ($-4k/yr) — negative.
- To cash-flow at today's rent, offer at most $288k (13.0% below list).
- To meet the 1% rule (rent ≥ 1% of price), the offer needs to be $252k (23.9% below list).
- It's been on market 16 days — a 2% lower offer ($326k) is reasonable based on typical stale-listing flexibility.
- Recommended offer: $252k (23.9% below list) — sets the bar for 1% rule.
- Local home prices are declining (-1.7%/yr); year-one equity from $2k of loan paydown is wiped out by about $6k of value loss. Plan a longer hold.
- Location reads 67/100 on livability (#526 in TX) — a middle-class / working-renter tenant base. Strengths: housing A+, crime A, employment A; Watch: amenities F, commute F, health & safety F.
- Fort Bend ISD (suburban): math 44% / reading 53% proficiency, ranked #140 of 826 in TX (top 17%) — families likely to look elsewhere, expect single-tenant / working-renter base with shorter leases.
- Market conditions: Rents soft (-0.1%/yr); 1215 active listings in the ZIP; 11 comparable units currently listed for rent nearby; rentals at typical pace (median 21d on market — plan ~3-4 weeks tenant-placement turnaround); high-income renter base; 12,093 units permitted in Fort Bend County in 2024 (815 in 5+ unit buildings).
- Fort Bend County population projected at +75% by 2050 — long-run rental-demand tailwind backs the buy-and-hold thesis.
- Climate carrying-cost: severe wind risk, 99% chance of damaging wind over 30y; moderate wildfire risk; extreme-heat days projected 7→21/yr by 2055 (HVAC capex compounding) — expect insurance premiums to compound above CPI over the hold.
- Cap rate 5.2% vs local median 3.5% in Missouri City — top-decile yield for the area; either an underpriced asset or a hidden risk that comps aren't pricing in. Stress-test before assuming the spread holds.
Questions for listing agent
- What do current leases actually rent for vs. the listed asking? Can we see a recent rent roll and the last 12 months of T-12 income?
- Is there a deadline driving the sale (1031 exchange, divorce, estate, relocation)? That informs how much negotiation room exists.
- Schools are B-rated — typically a magnet for longer-tenancy family renters. What's the average tenant stay here, and is there a school-zone premium baked into asking?
- The area grade is low — what's the realistic commute time and amenity access for the typical tenant pool here? Any planned neighborhood developments (good or bad) we should know about?
- What's the average days-on-market for RENTAL listings here right now (not sales)? A rising rental-DOM trend means longer vacancies and softer asking-rent achievability than the comps imply.
- What's the recent tenant-quality profile in this submarket — average credit score on applications, eviction rate, late-payment / NSF rate, and stable-employment percentage? A property-management company in the area should have these aggregated.
- How much new for-sale + rental construction is in the pipeline within 1–3 miles? Heavy new supply typically softens prices + rents 12–24 months out; constrained supply supports both.
CashFlowRE · CFR-7976MN4B9MEMDA
· Data 2 days ago
cashflowre.app · 2026-05-29