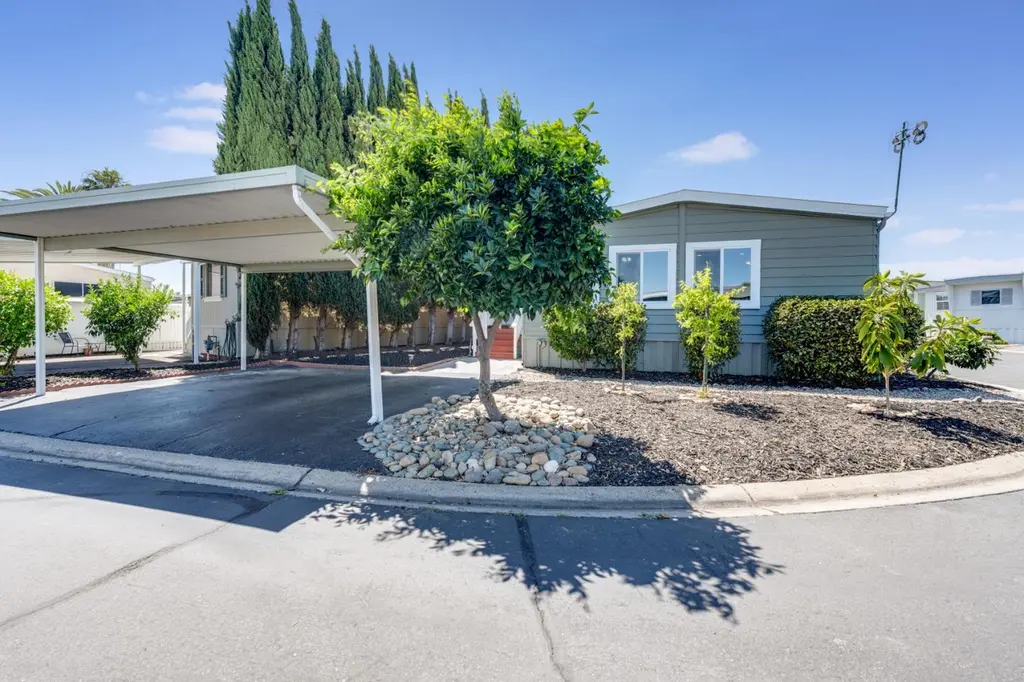
279 Heritage Glenn Ln
Rancho Cordova, CA 95670
$134,888B-
2 bd · 2.0 ba ·
1,150 sqft ·
Built 1977
· Manufactured
· Active
· 15 DOM
Cashflow @ list (25.0% down · 7.5%)
Estimated rent
$2,051/mo
Mortgage (P&I)
−$707
Tax + insurance
−$225
HOA
−$0
Vac / Maint / Mgmt
−$431
Net cashflow
$688/mo
Annual
$8,256/yr
Cap rate
12.41%
Cash-on-cash
21.86%
DSCR
1.97
1% rule
1.52%
Cash to close
$37,769
Investor read
- This is a 2-bed/2.0-bath manufactured listed at $135k. Condition is rated good.
- At list price, monthly cash flow is $688 ($8k/yr) — positive.
- The deal already cash-flows at list — no discount required.
- Meets the 1% rule at list price ($2k rent vs $135k).
- It's been on market 15 days — a 2% lower offer ($133k) is reasonable based on typical stale-listing flexibility.
- Recommended offer: $133k (1.5% below list) — sets the bar for market timing.
- Local home prices are declining (-3.0%/yr); year-one equity from $933 of loan paydown is wiped out by about $4k of value loss. Plan a longer hold.
- Location reads 68/100 on livability (#268 in CA) — a middle-class / working-renter tenant base. Strengths: housing A+, employment B; Watch: commute C-, crime D, cost of living F.
- San Juan Unified (suburban): math 40% / reading 62% proficiency, ranked #138 of 517 in CA (top 27%) — acceptable for families but not a draw, mixed tenant base, ~2y average lease.
- Zoned schools: Gold River Discovery Center K-8 (699 students, 29% FRL); John Barrett Middle (math 24% / reading 24%, grade F, #277 of 498 statewide, top 73%, 672 students, 49% FRL); Rio Americano High (math 37% / reading 66%, grade D+, #312 of 1,170 statewide, top 27%, 1,884 students, 28% FRL).
- Zoned-school proficiency averages 38% at this address vs 51% district-wide (-13 pts) — the specific schools serving this property underperform the San Juan Unified average; the district grade overstates school quality for this exact location.
- Market conditions: Rents flat; 226 active listings in the ZIP; 21 comparable units currently listed for rent nearby; rentals at typical pace (median 20d on market — plan ~3-4 weeks tenant-placement turnaround); solid renter incomes; 6,825 units permitted in Sacramento County in 2024 (1,752 in 5+ unit buildings).
- Sacramento County population projected at +17% by 2050 — long-run rental-demand tailwind backs the buy-and-hold thesis.
- At projected returns (-3.0% appreciation + 0.9% rent growth), your $38k cash investment doubles in ~7 years — after that, you're playing with house money.
- Climate carrying-cost: extreme-heat days projected 7→16/yr by 2055 (HVAC capex compounding) — expect insurance premiums to compound above CPI over the hold.
- Cap rate 12.4% vs local median 3.0% in Rancho Cordova — top-decile yield for the area; either an underpriced asset or a hidden risk that comps aren't pricing in. Stress-test before assuming the spread holds.
Questions for listing agent
- Built in 1977 — when were the roof, HVAC, electrical panel, plumbing, and water heater last replaced?
- Is there a deadline driving the sale (1031 exchange, divorce, estate, relocation)? That informs how much negotiation room exists.
- Crime grade is D in this area — have there been break-ins, vandalism, or insurance claims at this property in the last 3 years? What carrier currently insures it and at what premium?
- What's the average days-on-market for RENTAL listings here right now (not sales)? A rising rental-DOM trend means longer vacancies and softer asking-rent achievability than the comps imply.
- What's the recent tenant-quality profile in this submarket — average credit score on applications, eviction rate, late-payment / NSF rate, and stable-employment percentage? A property-management company in the area should have these aggregated.
- How much new for-sale + rental construction is in the pipeline within 1–3 miles? Heavy new supply typically softens prices + rents 12–24 months out; constrained supply supports both.
CashFlowRE · CFR-79GZ4D3JCGBGM7
· Data 1 day ago
cashflowre.app · 2026-05-29