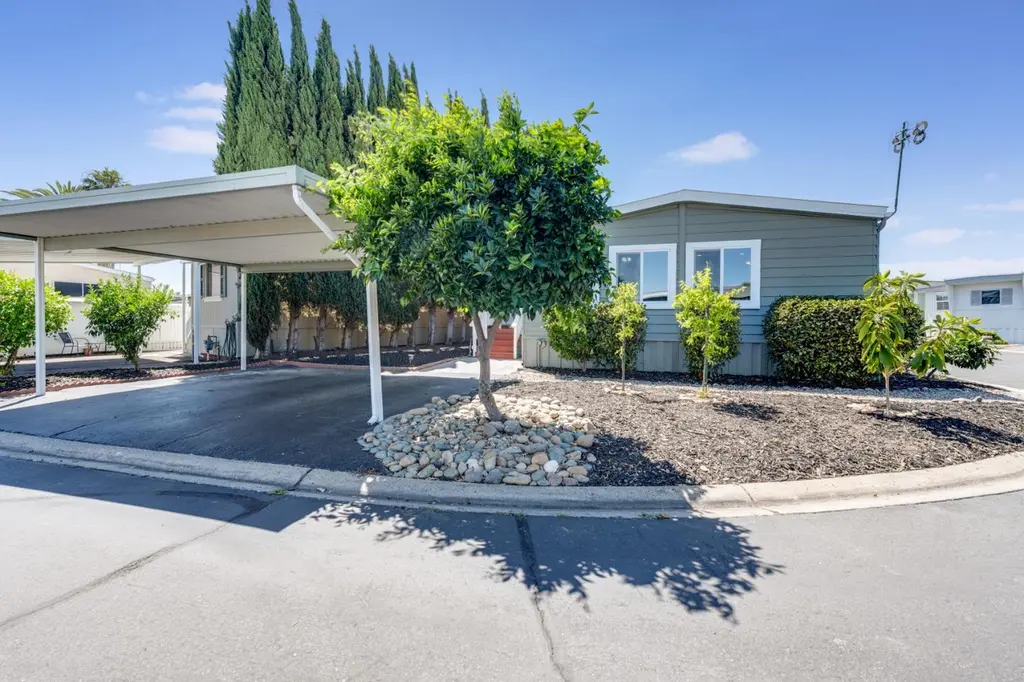
279 Heritage Glenn Ln · Rancho Cordova, CA
Flood risk 4/10 · Minor
- FEMA flood zone
- X (unshaded)
- Chance of flooding over 30 yrs
- 0.22%
- Est. flood insurance / yr
- $507 – $1,088
Fire risk 4/10 · Minor
- Est. fire insurance / yr
- $659 – $1,223
Heat risk 7/10 · Major
- Hot days now (above 102°F)
- 7 days/yr
- Hot days in 30 yrs
- 16 days/yr
Wind risk 1/10 · Minimal
- Chance of severe wind over 30 yrs
- —
Air-quality risk 10/10 · Severe
- Unhealthy air days now
- 33 days/yr
- Unhealthy air days in 30 yrs
- 35 days/yr
Risk factors via First Street. Map © Google.
Why this score? — see what drove the B- grade
The composite is a weighted blend of 9 inputs, each scored 0–100. Each bar is that input's sub-score; the figure is the points it added to the 100-point composite (weight × sub-score).
- Cash flow +30.0/30.0
- 1% rule +10.0/10.0
- DSCR +10.0/10.0
- Schools +4.4/10.0
- Condition / age +3.8/5.0
- Livability +3.4/5.0
- Rent growth +2.7/5.0
- ARV discount +0.8/15.0
- Appreciation +0.0/10.0
$134,888
🖨 Deal sheet (PDF) 📄 Offer letter ✓ Due diligence
Listing remarks
Beautifully remodeled and move-in ready! This charming home features a bright, updated kitchen with white cabinetry, Quartz countertops, newer stainless steel appliances, and a generous serving bar. Enjoy the convenience of an indoor laundry area, energy-efficient dual-pane windows, and a large storage shed for all your storage needs. Located on a desirable corner lot with covered parallel parking, this home offers comfort, style, and functionality throughout.
Key facts
- Indoor laundry area
- Covered parking
- Remodeled kitchen
Tags
Property features AI
Finance
- Other: Property located at 279 Heritage Glenn Ln, Rancho Cordova, CA 95670; Directions: I-50 take Sunrise exit north to Zinfandel; go into park (near Palm View Lane)
- Financial info: Land lease not owned (land lease amount listed separately)
- HOA & community: No homeowner association; Located in a senior community; Community contains multiple units (community has 468 units)
Exterior
- Parking: Off-street parking for 2 vehicles; Covered parking; Detached parking; Boat storage available; Guest parking available
- Security: Service animals allowed (pets permitted: dogs and cats)
- Utilities: Public sewer; Public water via water district; Individual electric meter; Individual gas meter; Natural gas connected; DSL and internet available
- Home design: Manufactured in park (double wide); Kingswood make by Guerdon; Updated/remodeled; Built in 1977
- Construction: Composition roof; Wood skirting
- Exterior features: Carport awning and porch awning; Covered porch and deck (deck attached to family room); Fenced backyard; Front and miscellaneous landscaping; Close to clubhouse; Storage, shed(s) and outbuilding(s)
Interior
- Kitchen: Built-in electric oven; Free-standing gas range/oven; Free-standing refrigerator; Dishwasher; Disposal; Microwave; Self-cleaning oven; Ceramic, slab, synthetic, and marble counter surfaces
- Bedrooms: 2 bedrooms
- Flooring: Carpet; Simulated wood/laminate flooring
- Bathrooms: 2 full bathrooms; Tub with shower over; Shower stall(s)
- Heating & cooling: Central heating (natural gas); Ceiling fans; Central cooling
- Interior features: Updated/remodeled interior; Dual-pane windows with window coverings and screens; Caulked/sealed windows; Covered deck and porch with railings and porch steps; Storage and utility room space; Great room living area; Breakfast area and pantry in kitchen; Dining bar and flexible dining/formal areas
- Laundry & utility: Washer and dryer included; Laundry closet with inside area; Gas hook-up; 220 volts in laundry
Neighborhood map
What this means for you Summary
Snapshot
- This is a 2-bed/2.0-bath manufactured listed at $135k. Condition is rated good.
Deal economics
- At list price, monthly cash flow is $688 ($8k/yr) — positive.
- The deal already cash-flows at list — no discount required.
- Meets the 1% rule at list price ($2k rent vs $135k).
- Recommended offer: $133k (1.5% below list) — sets the bar for market timing.
- Cap rate 12.4% vs local median 3.0% in Rancho Cordova — top-decile yield for the area; either an underpriced asset or a hidden risk that comps aren't pricing in. Stress-test before assuming the spread holds.
Location & tenants
- Location reads 68/100 on livability (#268 in CA) — a middle-class / working-renter tenant base. Strengths: housing A+, employment B; Watch: commute C-, crime D, cost of living F.
- San Juan Unified (suburban): math 40% / reading 62% proficiency, ranked #138 of 517 in CA (top 27%) — acceptable for families but not a draw, mixed tenant base, ~2y average lease.
- Zoned schools: Gold River Discovery Center K-8 (699 students, 29% FRL); John Barrett Middle (math 24% / reading 24%, grade F, #277 of 498 statewide, top 73%, 672 students, 49% FRL); Rio Americano High (math 37% / reading 66%, grade D+, #312 of 1,170 statewide, top 27%, 1,884 students, 28% FRL).
- Zoned-school proficiency averages 38% at this address vs 51% district-wide (-13 pts) — the specific schools serving this property underperform the San Juan Unified average; the district grade overstates school quality for this exact location.
- Market conditions: Rents flat; 226 active listings in the ZIP; 21 comparable units currently listed for rent nearby; rentals at typical pace (median 22d on market — plan ~3-4 weeks tenant-placement turnaround); solid renter incomes; 6,825 units permitted in Sacramento County in 2024 (1,752 in 5+ unit buildings).
Forward outlook
- Local home prices are declining (-3.0%/yr); year-one equity from $933 of loan paydown is wiped out by about $4k of value loss. Plan a longer hold.
- Sacramento County population projected at +17% by 2050 — long-run rental-demand tailwind backs the buy-and-hold thesis.
- At projected returns (-3.0% appreciation + 0.9% rent growth), your $38k cash investment doubles in ~7 years — after that, you're playing with house money.
Negotiation context
- It's been on market 15 days — a 2% lower offer ($133k) is reasonable based on typical stale-listing flexibility.
Risks & watch-outs
- Climate carrying-cost: extreme-heat days projected 7→16/yr by 2055 (HVAC capex compounding) — expect insurance premiums to compound above CPI over the hold.
Questions for the listing agent
- Built in 1977 — when were the roof, HVAC, electrical panel, plumbing, and water heater last replaced?
- Is there a deadline driving the sale (1031 exchange, divorce, estate, relocation)? That informs how much negotiation room exists.
- Crime grade is D in this area — have there been break-ins, vandalism, or insurance claims at this property in the last 3 years? What carrier currently insures it and at what premium?
- What's the average days-on-market for RENTAL listings here right now (not sales)? A rising rental-DOM trend means longer vacancies and softer asking-rent achievability than the comps imply.
- What's the recent tenant-quality profile in this submarket — average credit score on applications, eviction rate, late-payment / NSF rate, and stable-employment percentage? A property-management company in the area should have these aggregated.
- How much new for-sale + rental construction is in the pipeline within 1–3 miles? Heavy new supply typically softens prices + rents 12–24 months out; constrained supply supports both.
Investment metrics
- 1% rule
- 1.52% ✓
- Cap rate
- 12.41%
- Cash-on-cash
- 21.86%
- DSCR
- 1.97
- GRM
- 5.5
CMA / ARV
- ARV (on-the-fly)
- $117,300
- Comps found
- 12
Show comp detail 12 sales within ~0.75 mi
| Address | Dist | Beds/Ba | Sqft | Sold | Price | $/sf | Match |
|---|---|---|---|---|---|---|---|
| 311 Sunny Hills Dr | 0.03mi | 2/2.0 | 1,200 (+4%) | 5mo | $99,900 | $83 | 87 |
| 191 Whispering Pines Dr | 0.17mi | 2/2.0 | 1,152 (+0%) | 8mo | $65,000 | $56 | 85 |
| 131 Royal Wood Ln | 0.09mi | 2/2.0 | 1,095 (-5%) | 3mo | $140,000 | $128 | 85 |
| 172 Rolling River Ln | 0.31mi | 2/2.0 | 1,160 (+1%) | 10mo | $105,000 | $91 | 75 |
| 396 Ravine Cir | 0.13mi | 2/2.0 | 1,280 (+11%) | 1mo | $115,000 | $90 | 74 |
| 55 Sheri Ridge Way | 0.21mi | 2/2.0 | 1,212 (+5%) | 8mo | $129,900 | $107 | 74 |
| 146 Gumtree Dr | 0.23mi | 2/2.0 | 1,100 (-4%) | 10mo | $126,000 | $115 | 74 |
| 66 Pineacre Ln | 0.24mi | 2/2.0 | 1,080 (-6%) | 8mo | $126,900 | $118 | 72 |
| 126 Royalwood Ln | 0.08mi | 3/2.0 (+1) | 1,080 (-6%) | 14mo | $110,000 | $102 | 70 |
| 192 Whispering Pines Dr | 0.18mi | 2/2.0 | 1,248 (+8%) | 11mo | $65,000 | $52 | 68 |
| 259 Rocky Hills Ln | 0.05mi | 2/1.0 | 990 (-14%) | 6mo | $94,900 | $96 | 66 |
| 86 Wilderness Rd | 0.24mi | 3/2.0 (+1) | 1,029 (-10%) | 13mo | $121,000 | $118 | 56 |
Match score weights: distance 35% · size 25% · config 20% · recency 20%. Top-matched comps best support the ARV.
Projected returns pro-forma
-3.0% appreciation · 0.9% rent growth · sell at horizon
- IRR
- 12.1%
- Equity multiple
- 1.47×
- Total profit
- $17,748
- Equity at exit
- $20,112
- IRR
- 19.4%
- Equity multiple
- 2.46×
- Total profit
- $55,306
- Equity at exit
- $11,663
Cash invested: $37,769 (down + closing). Projections, not guarantees.
Landlord ↔ Tenant lean methodology
- Overall (STATE)
- 18 Strongly Tenant-Friendly
- State California
- 18 Strongly Tenant-Friendly · D+13
- County
- — inherits STATE
- City
- — inherits STATE
ZIP-level market 95670
- Rents YoY
- 0.9%
- Active inventory
- 226
- Price-to-rent
- 5.5×
Monthly cashflow live
- Estimated rent
- $2,051 high interval (Pro) →
- Mortgage (P&I)
- −$707
- Tax est. 1.5%
- −$169 /mo · $2,023/yr
- Insurance
- −$56
- HOA
- −$0
- Vacancy / Maint / Mgmt
- −$431
- Net cashflow
- $688
Break-even live
Sensitivity live
| Price | -10% $781 | -5% $735 | +0% $688 | +5% $641 | +10% $595 |
|---|---|---|---|---|---|
| Rent | -10% $526 | -5% $607 | +0% $688 | +5% $769 | +10% $850 |
| Rate | -1.0pp $756 | -0.5pp $722 | base $688 | +0.5pp $653 | +1.0pp $617 |
UW: 25.0% down · 7.5% · 30yr · 1.5% tax · 5.0% vac · 8.0% maint · 8.0% mgmt
Financing live
Cash to close
- Down payment
- $33,722
- Closing costs
- $4,047
- Reserves months
- —
- Total cash needed
- —
Loan-product check · same deal, 3 products live
Conventional
25% down · 7.5% · 30yr
- Down + closing
- —
- Monthly P&I
- —
- Monthly cashflow
- —
- DSCR
- —
- Eligible?
- —
Personal DTI + credit; lowest rate.
DSCR
20% down · 8.5% · 30yr
- Down + closing
- —
- Monthly P&I
- —
- Monthly cashflow
- —
- DSCR
- —
- Eligible?
- —
No personal income docs; deal must DSCR.
Hard money
10% down · 12.0% · 12mo
- Down + closing
- —
- Monthly P&I
- —
- Monthly cashflow
- —
- DSCR
- —
- Eligible?
- —
Short-term bridge; refi at stabilization.
Rent comps 21 comps
| Address | Beds | Baths | Sqft | Rent | $/sqft | DOM | Units | Dist |
|---|---|---|---|---|---|---|---|---|
| 11260 Point East Dr Rancho Cordova, CA | 1.0–2.0 | 1.0 | 615 | $1,985 | $3.23 | 3d | 29 | 0.33mi |
| 2437 Rashawn Dr Rancho Cordova, CA | 2.0 | 1.0 | 970 | $1,900 | $1.96 | 9d | 1 | 0.36mi |
| 2330 Vehicle Dr Rancho Cordova, CA | 1.0–2.0 | 1.0–2.0 | 847 | $2,225 | $2.63 | 4d | 1 | 0.37mi |
| 2330 Vehicle Dr Rancho Cordova, CA | 1.0–2.0 | 1.0–2.0 | 847 | $2,230 | $2.63 | 22d | 9 | 0.37mi |
| 11070 Hirschfeld Way Rancho Cordova, CA | 1.0–2.0 | 1.0 | 800 | $1,880 | $2.35 | 4d | 4 | 0.44mi |
| 11150 Trinity River Dr Rancho Cordova, CA | 2.0–3.0 | 2.0 | 1091 | $1,850 | $1.69 | 45d | 2 | 0.49mi |
| 2220 Cemo Cir Gold River, CA | 2.0–3.0 | 2.0 | 1203 | $2,499 | $2.08 | 3d | 7 | 0.53mi |
| 11150 Trinity River Dr #79 Rancho Cordova, CA | 2.0 | 1.0 | 941 | $1,980 | $2.10 | 25d | 1 | 0.53mi |
| 11112 Congo River Ct Rancho Cordova, CA | 3.0 | 2.0 | 1407 | $2,750 | $1.95 | 19d | 1 | 0.55mi |
| 10890 Coloma Rd Rancho Cordova, CA | 2.0 | 1.0 | 925 | $1,499 | $1.62 | 25d | 3 | 0.81mi |
| 10870 Coloma Rd Rancho Cordova, CA | 2.0 | 1.0 | 950 | $1,499 | $1.58 | 4d | 1 | 0.89mi |
| 10922 Scotsman Way Rancho Cordova, CA | 2.0 | 2.0 | 1100 | $2,050 | $1.86 | 19d | 1 | 0.93mi |
| 2253 Zinfandel Dr Rancho Cordova, CA | 3.0 | 2.0 | 1204 | $2,200 | $1.83 | 45d | 1 | 0.93mi |
| 10918 Scotsman Way Unit 10918 Rancho Cordova, CA | 2.0 | 2.0 | 1183 | $1,795 | $1.52 | 45d | 1 | 0.94mi |
| 2652 Los Nogales Way Rancho Cordova, CA | 2.0 | 2.0 | 1000 | $2,000 | $2.00 | 45d | 1 | 0.99mi |
| 1990 Benita Dr Rancho Cordova, CA | 2.0 | 1.5 | 960 | $2,300 | $2.40 | 45d | 1 | 1.00mi |
| 2657 McGregor Dr Rancho Cordova, CA | 2.0 | 2.0 | 1012 | $1,595 | $1.58 | 45d | 1 | 1.02mi |
| 10780 Coloma Rd Rancho Cordova, CA | 1.0–2.0 | 1.0 | 760 | $1,515 | $1.99 | 4d | 7 | 1.03mi |
| 10680 Coloma Rd Rancho Cordova, CA | 1.0–2.0 | 1.0 | 730 | $1,889 | $2.59 | 4d | 11 | 1.25mi |
| 2751 Don Juan Dr Apt 16 Rancho Cordova, CA | 2.0 | 1.5 | 960 | $1,875 | $1.95 | 45d | 1 | 1.36mi |
| 2730 Don Juan Dr Rancho Cordova, CA | 2.0 | 1.0 | 800 | $1,650 | $2.06 | 45d | 2 | 1.42mi |
Listing history 11 events
-
2026-06-21days on market $134,888 Active 15 DOM
-
2026-06-18days on market $134,888 Active 12 DOM
-
2026-06-17days on market $134,888 Active 11 DOM
-
2026-06-16days on market $134,888 Active 10 DOM
-
2026-06-15days on market $134,888 Active 9 DOM
-
2026-06-13days on market $134,888 Active 7 DOM
-
2026-06-13days on market $134,888 Active 6 DOM
-
2026-06-09days on market $134,888 Active 3 DOM
-
2026-06-08days on market $134,888 Active 2 DOM
-
2026-06-07remarks 464-char remark
-
2026-06-07$134,888 Active 1 DOM
ⓘ Source: listings_history table (triggers on properties + properties_extension) + one-shot
backfill from property_details.listing_events for pre-trigger history.
Climate risk First Street
- Flood 4/10 Moderate FEMA zone X (unshaded) · 22% chance over 30 yrs
- Wildfire 4/10 Moderate
- Heat 7/10 Severe 7 d/yr ≥102°F today · 16 d/yr by 30 yrs out
- Wind 1/10 Low
- Air quality 10/10 Extreme 33 unhealthy d/yr today · 35 by 30 yrs out
Nearby sold comps map
Loading sold comps map…
Walkable amenities ~0.75 mi
Loading nearby amenities…
Taxation est. · year 1
- Rental income
- $24,610
- − Mortgage interest
- −$7,556
- − Property taxes
- −$2,023
- − Insurance
- −$674
- − Repairs & maintenance
- −$1,969
- − Management
- −$1,969
- − Depreciation
- −$3,924
- Taxable income
- $6,495
- Est. tax owed @ 24.0%
- −$1,559
- After-tax cash flow
- $6,697/yr
For passive investors: Depreciation is non-cash, so a rental often shows a tax loss while cash-flowing — sheltering income. Rental losses are passive: they offset passive income freely, and up to $25,000/yr can offset ordinary (W-2) income if you actively participate and your MAGI is under $100k (phasing out to $0 by $150k); unused losses carry forward. On sale, claimed depreciation is recaptured at up to 25%, and gains may owe capital-gains tax (a 1031 exchange can defer both). Figures are a year-1 estimate at your 24.0% rate — not tax advice; consult a CPA.
Condition & rehab AI · 6 photos
This charming mobile home is beautifully remodeled and move-in ready, featuring updated kitchens and bathrooms, and a well-maintained exterior with a covered carport and storage shed.
Value-add opportunities
- Both Paint the exterior siding — Enhances curb appeal and value
- Both Trim the landscaping — Improves curb appeal and enhances the home's aesthetic
Renovation cost estimate screening
Value-add ROI direction
- Both Paint the exterior siding — Enhances curb appeal and value ↑
- Both Trim the landscaping — Improves curb appeal and enhances the home's aesthetic ↑
ⓘ Cost ranges are severity-bucket heuristics (US national rule-of-thumb). Get contractor quotes + a written scope before underwriting a rehab budget.
Schools (NCES district)
- District
- San Juan Unified
- NCES district ID
- 0634620
- Math proficiency
- 40% ▲ 3.00%
- Reading proficiency
- 62% ▲ 16.00%
- Median HH income
- $55,655
- Composite
- 44.07/100
- National rank
- #2878
- State rank
- #138 of 517 in CA
Livability — Rancho Cordova
- Score
- 68/100
- State rank
- #268
- US rank
- #9126
Category grades
Schools grade is shown separately in the Schools card above.
Census & demographics
- Census place
- Rancho Cordova, CA
- County
- Sacramento County · 1,539,646 people
- City population
- 98,329
- Metro
- Sacramento-Roseville-Folsom, CA
- Population (ZIP)
- 58,819
- Household income
- $89,484
- Rent vs Own
- Severe rent burden
- 2389.0
Population outlook (Sacramento County) Hauer SSP2
- Today (2025)
- 1,660,763 people
- By 2030
- 1,732,990 · +4.3%
- By 2040
- 1,855,755 · +11.7%
- By 2050
- 1,941,335 · +16.9%
- By 2075
- 2,046,162 · +23.2%
- By 2100
- 1,961,444 · +18.1%
Race, ethnicity, and origin ACS 2023
- Neighborhood character
- Diverse neighborhood (Simpson 0.67)
- Race & ethnicity
- White 51% Hispanic / Latino 21% Two or more races 12% Asian 12% Black 10% Native American 1%
- Hispanic origin (detail)
- Mexican 17%
- Common ancestry
- Scotch-Irish 2% Subsaharan African 2% Italian 2%
- Foreign-born
- 24% · Canada, Vietnam, South Korea
- Languages at home
- 66% English-only · Spanish 13% Other Indo-European 7% Russian/Polish/Slavic 5%
Political lean MEDSL · Sacramento
- 2024 margin
- D (+19.7) · D 58.1% · R 38.4% · Other 3.5%
- 2008→2024 swing
- +0.7pp no change · 2008: 19.0pp · 2024: 19.7pp
- All cycles
- 2024: D+19.7 2020: D+25.3 2016: D+23.7 2012: D+16.3 2008: D+19.0
Not yet ingested
- Civics
- —
Market trends
- HPI YoY
- ▼ -263.38%
- Current HPI
- 300.0788
- Rent YoY
- ▲ 0.90%
- Metro
- Sacramento-Roseville-Folsom, CA
- State GDP YoY
- ▲ 3.21%
- F500 in state
- 116
Industry mix (Fortune 500 HQ in CA)
| Industry | F500 HQs | Revenue |
|---|---|---|
| Technology | 27 | $1,492B |
|
||
| Financial Services | 3 | $174B |
|
||
| Retail | 3 | $44B |
|
||
| Insurance | 3 | $26B |
|
||
| Media / Entertainment | 2 | $115B |
|
||
| Pharmaceuticals / Biotech | 2 | $62B |
|
||
Cash-flow waterfall
monthlySold comps — $/sqft
last 12 mo · ≤1 miLoading sold comps…